Yujia Zhao

Work

About

Product-led growth for a no-code data prep enterprise tool

trial & GROWTH

onboarding

journey design

Improved trial-to-paid conversion rate by 200% through journey & friction analysis, A/B testing experiments, and streamlining user experience.
Trifacta, a no-code cloud data cleansing & preparation tool, established a Growth Team, with the mission of acquiring, engaging, and retaining small to medium customers through trials and product-led growth. I was the UX Team Lead on the Growth Team, responsible for:

  • Define growth strategy with Product and Engineering Leaders
  • Design projects planning
  • Hand-on execution of growth project as well as overseeing another junior designer’s work in a fast-paced environment.

My role

Lead Designer

Worked with

1 designers, 2 PMs, 1 Tech Lead, 1 Data Analyst

Time

2022-2023

Journey & Frictions Workshop

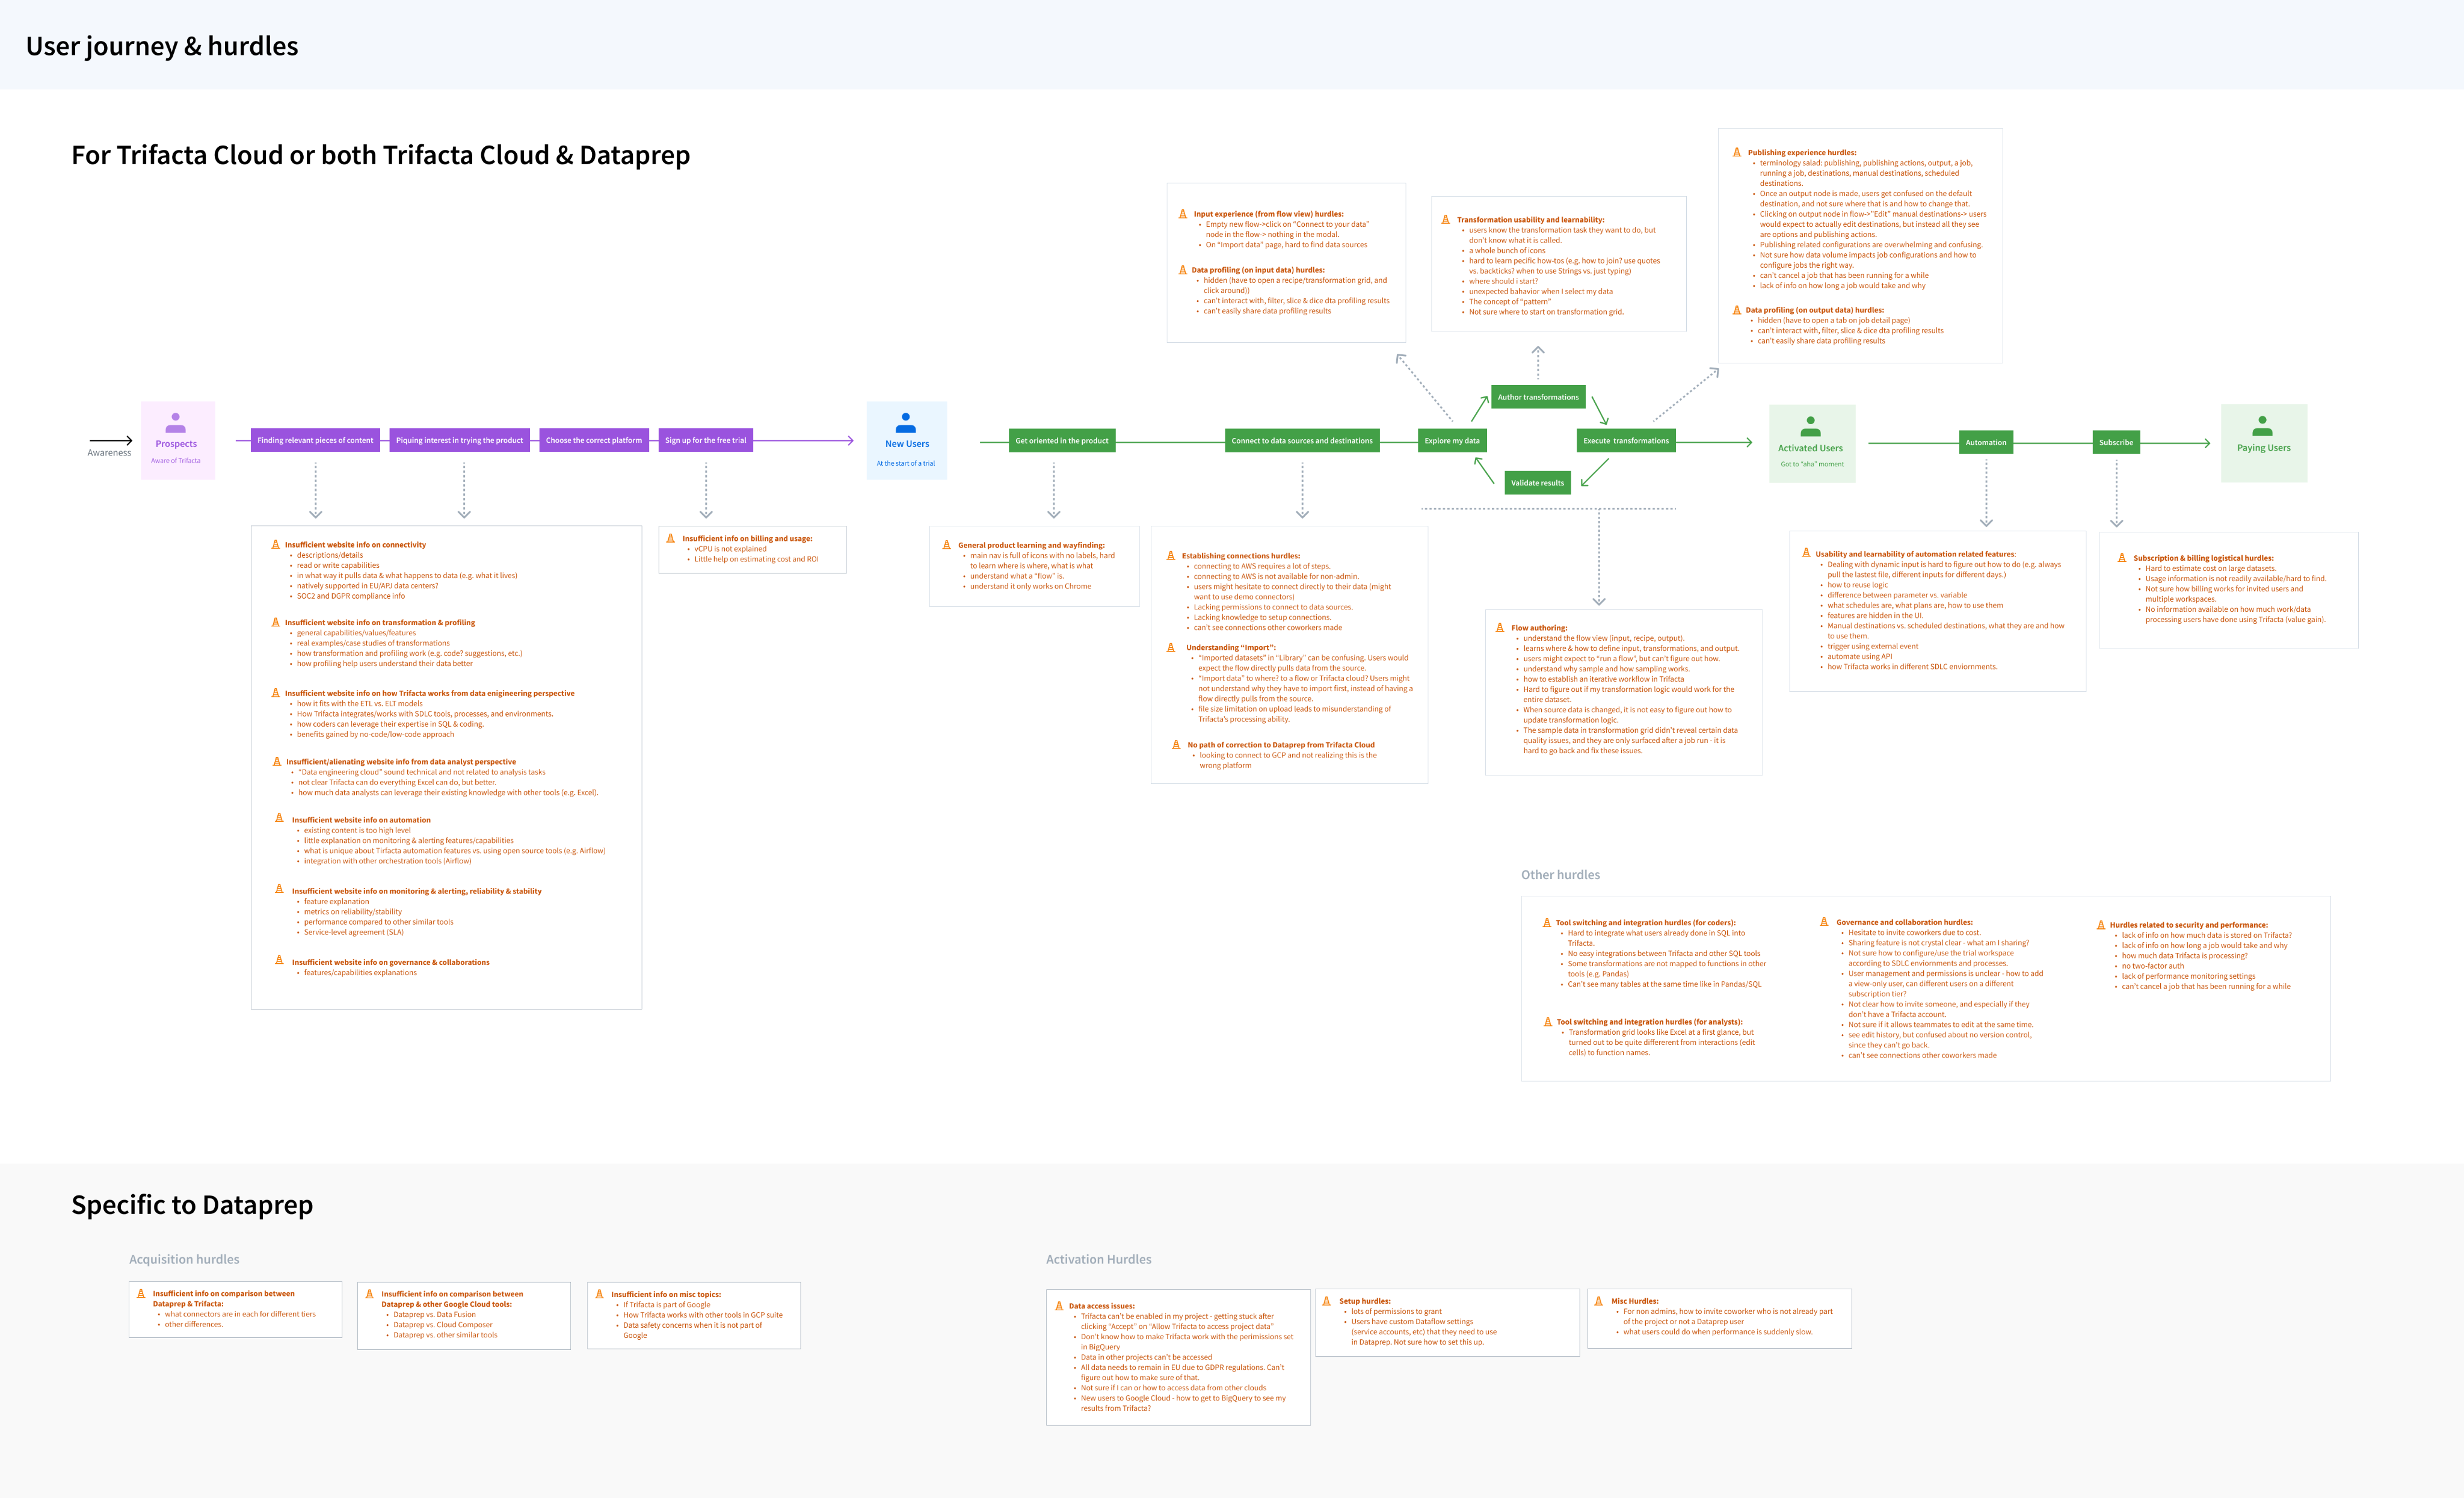
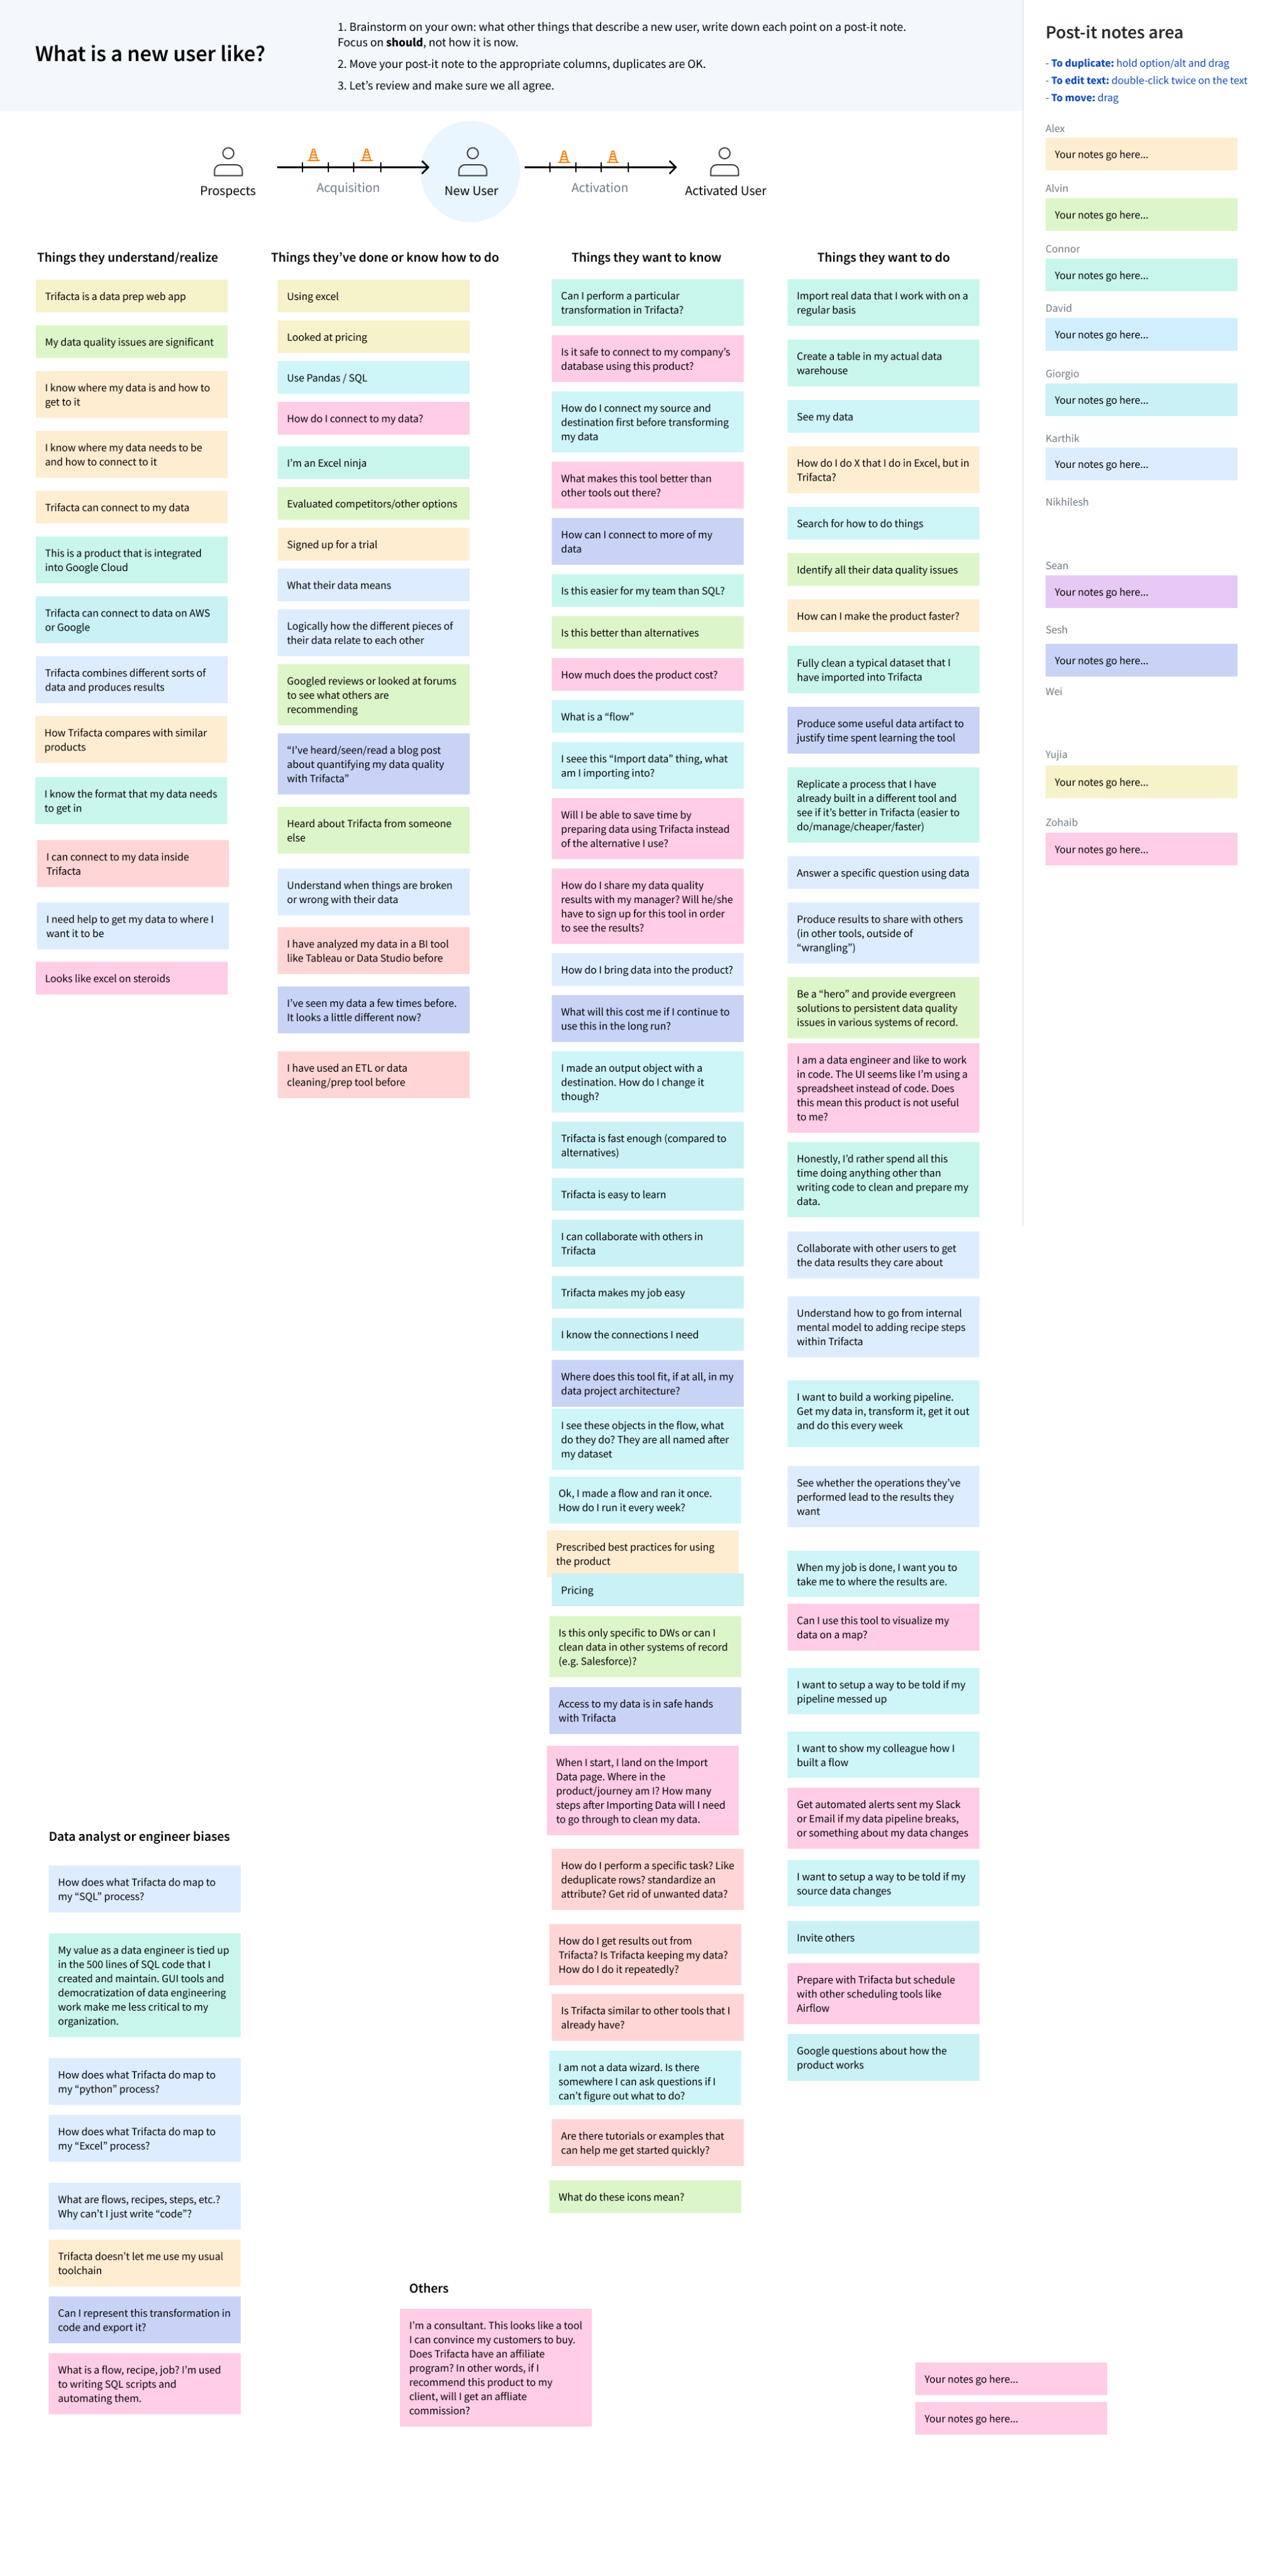
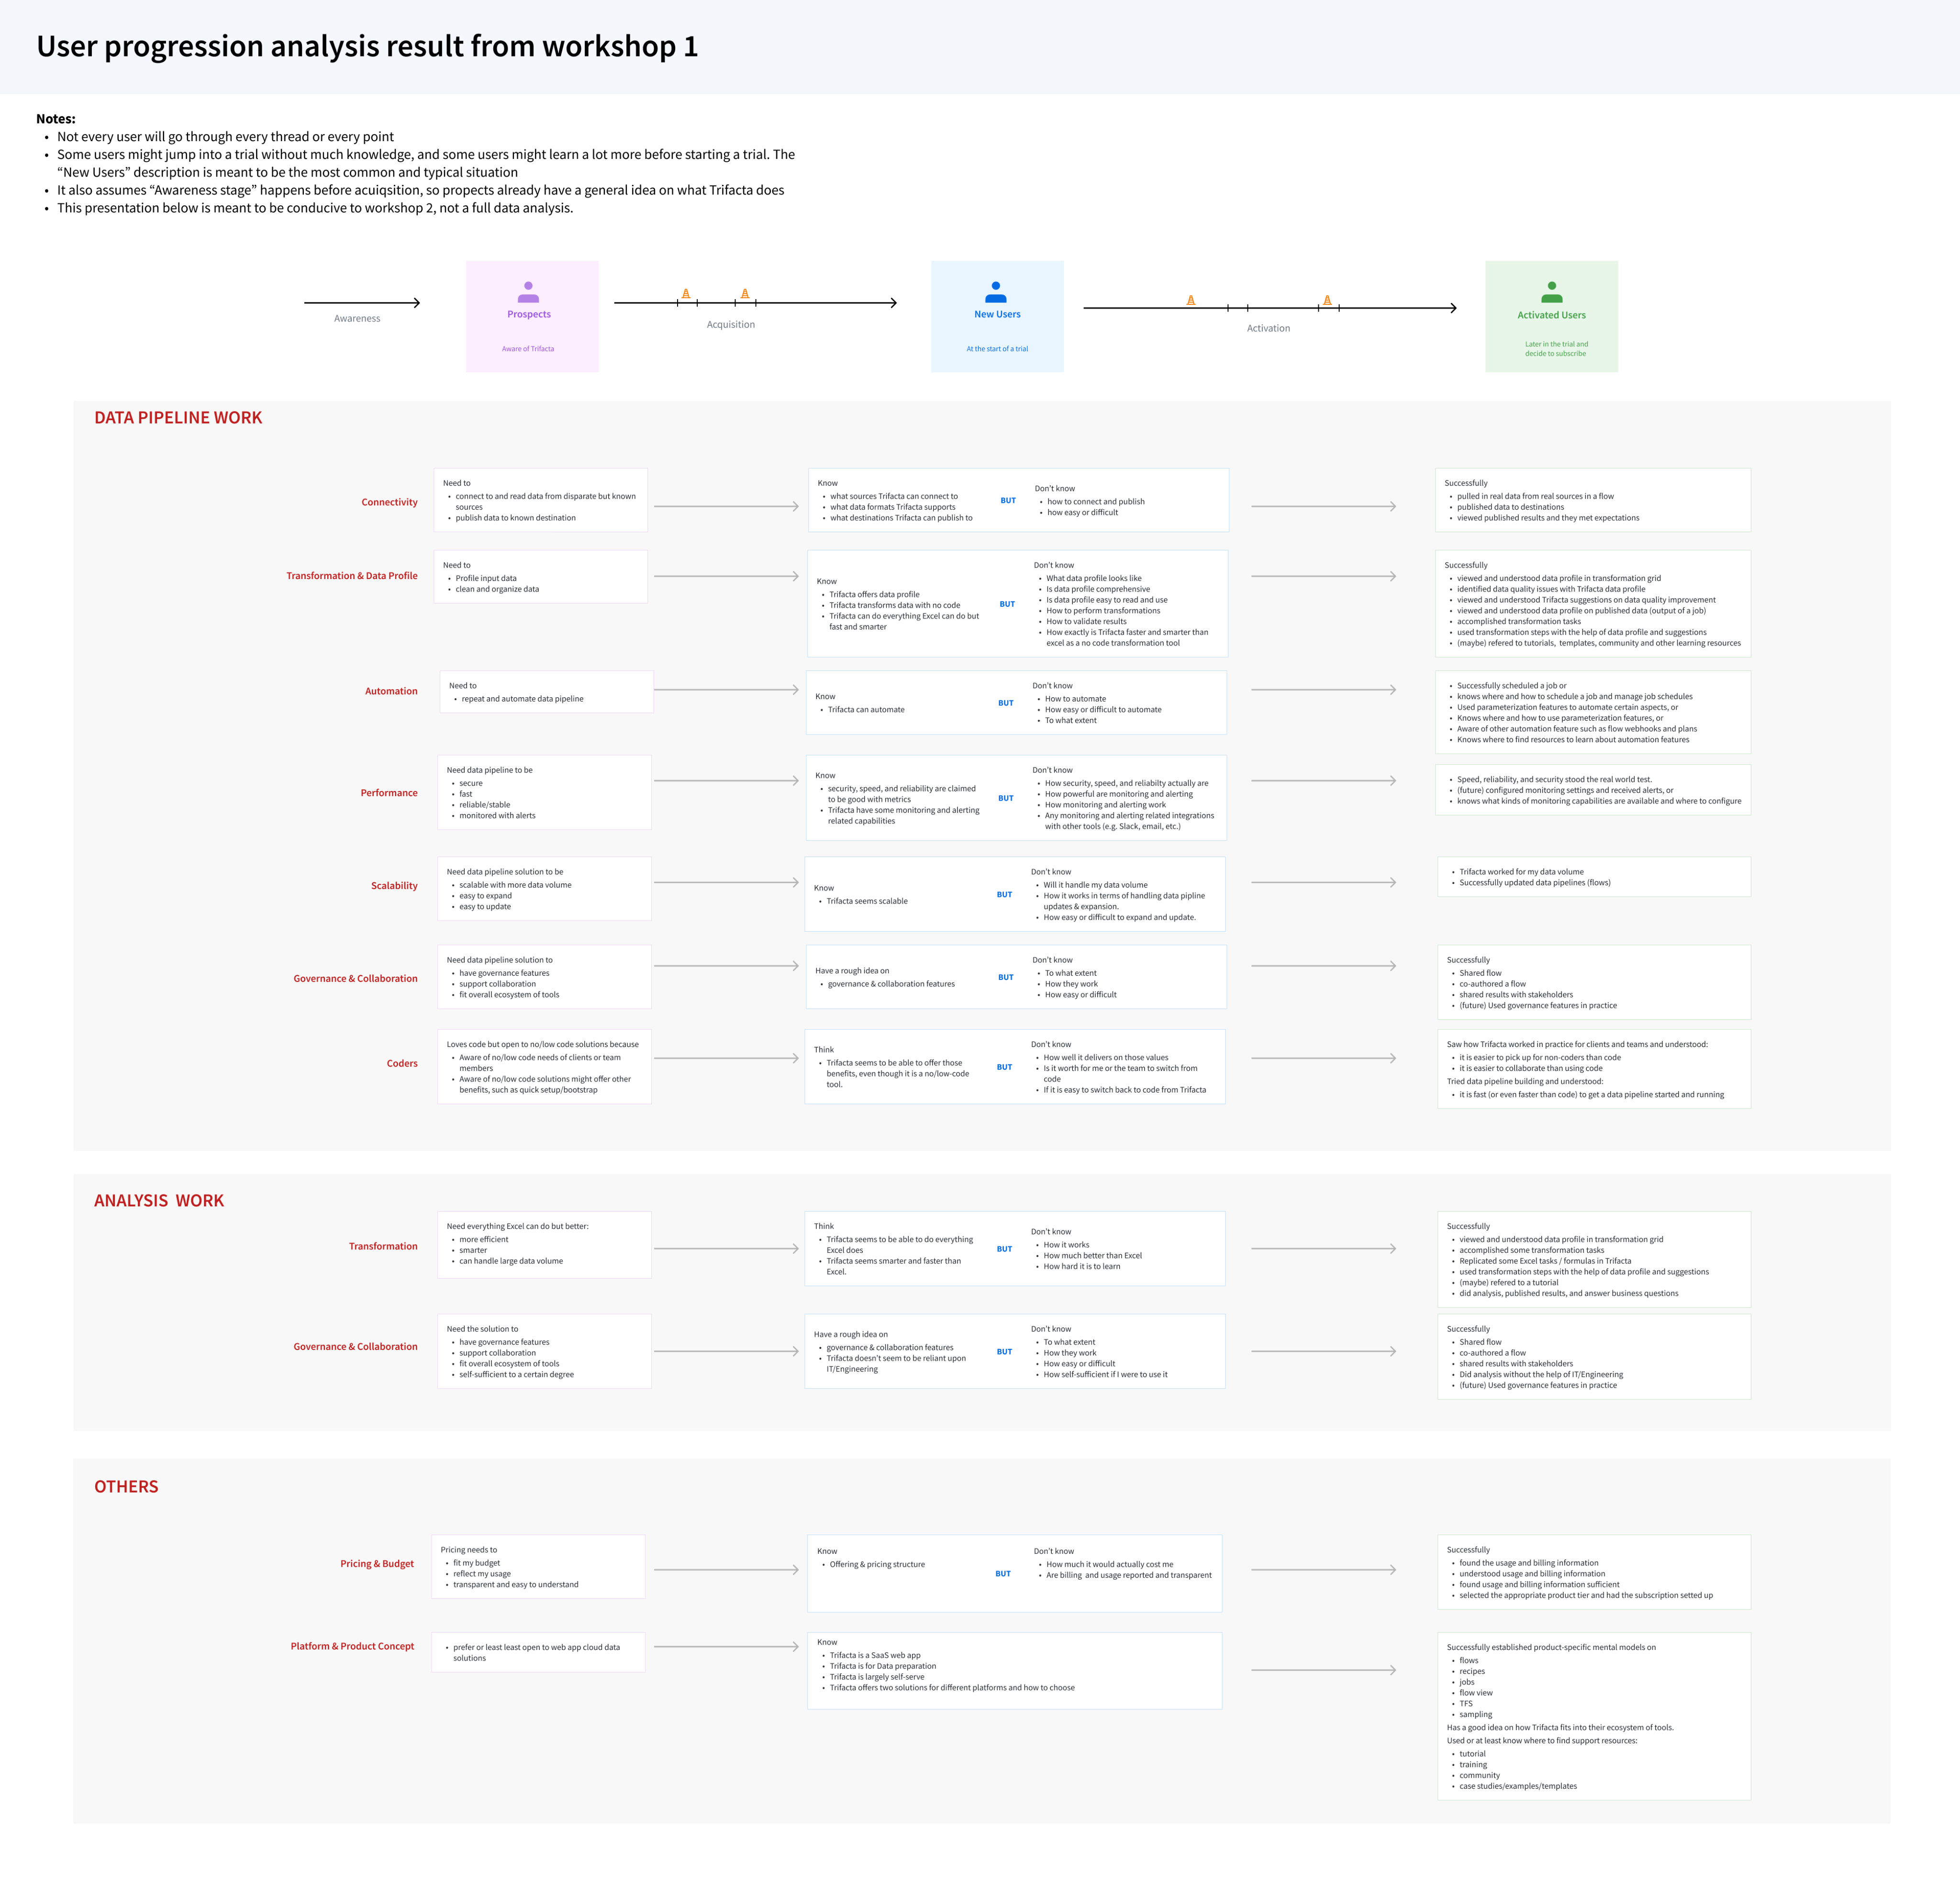
Surface and align our understanding pf the holistic user journey

Growth practice is based on the cycle of hypothesis, A/B experiment testing, and learning. However, as a designer, I want to ground hypothesis in user insights, and that starts from the end-to-end user journey and our shared understanding of the frictions.
First focus - top of the tunnel

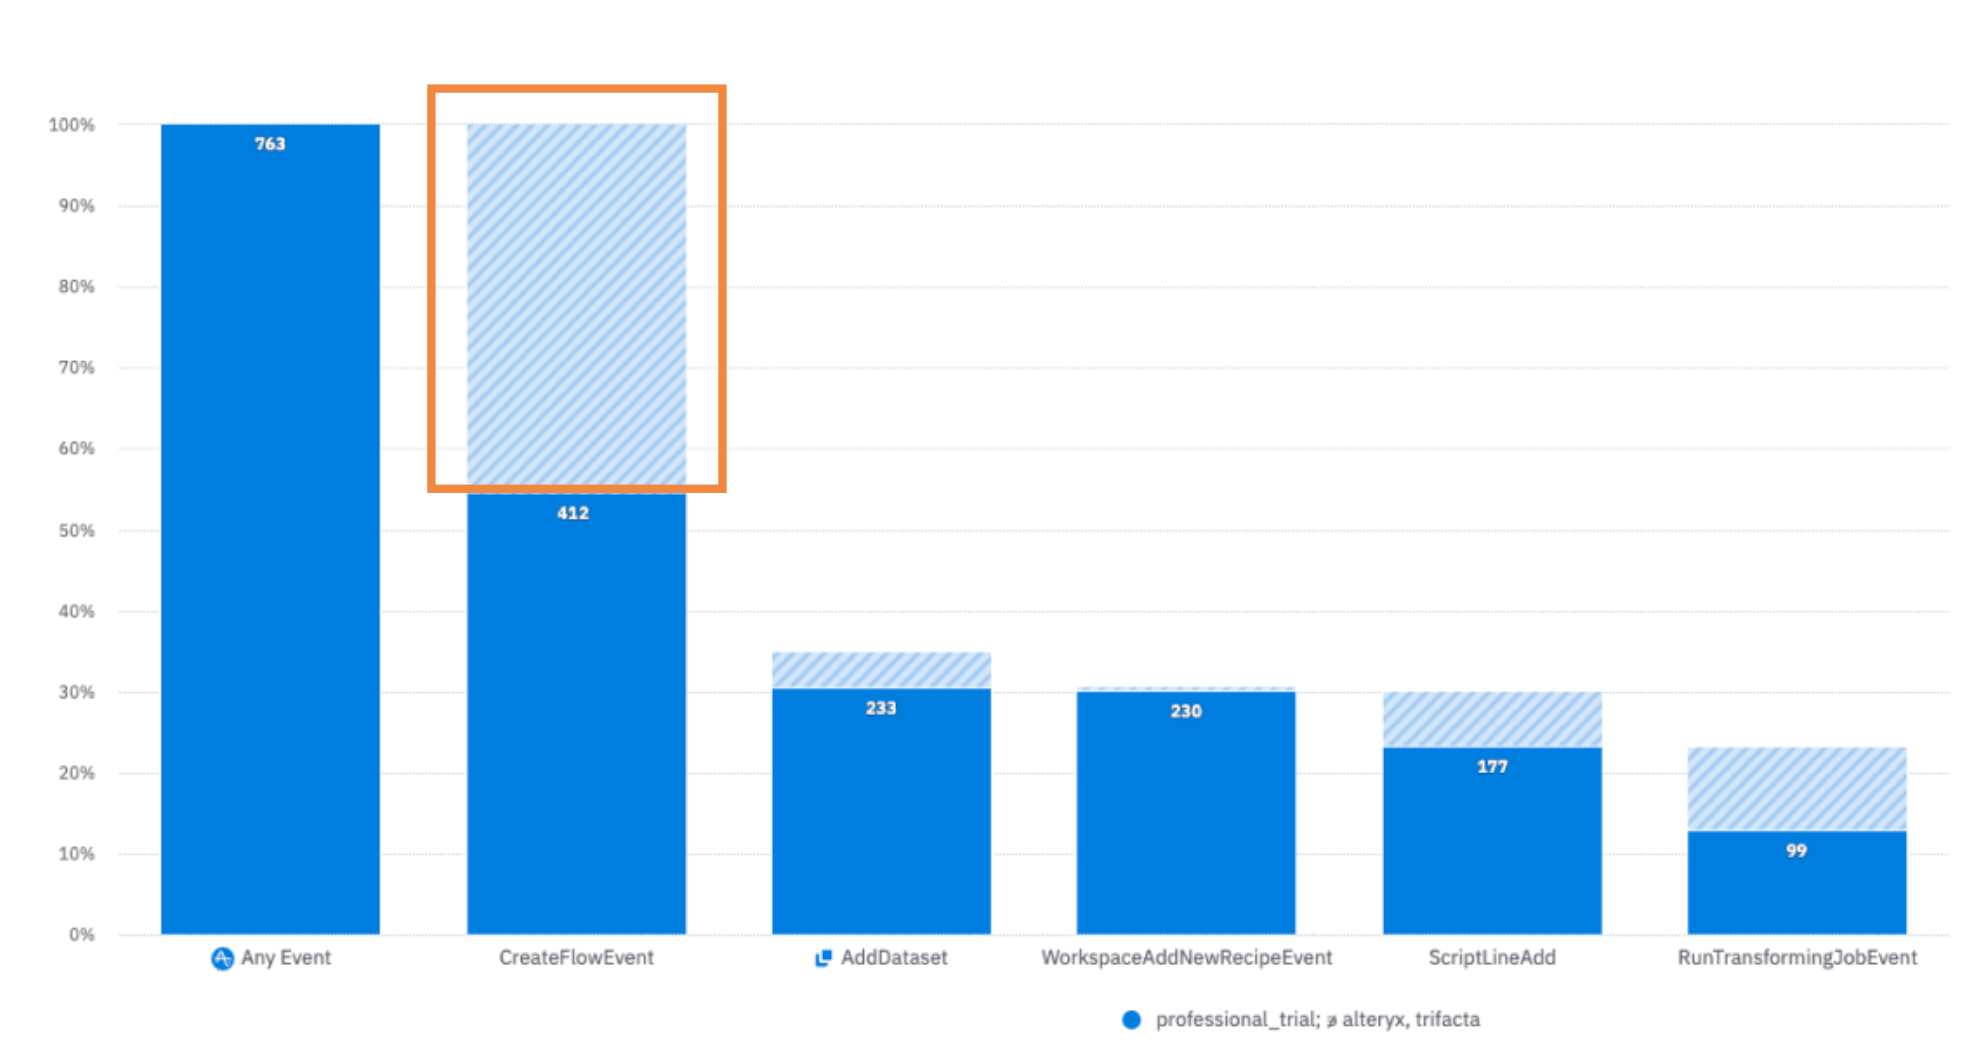
We are losing half the people at the very beginning of the journey

Equipped with a holistic understanding, we also dived into data to see what part of the journey to focus first. We learned that we have a near 50% drop-off for Flow creation. This is very concerning, because Flow is the only object/vehicle in Trifacta for users to transform data. If they are not even creating Flows, they are definitely not experiencing aha moment, let alone subscribe.
Hypothesis

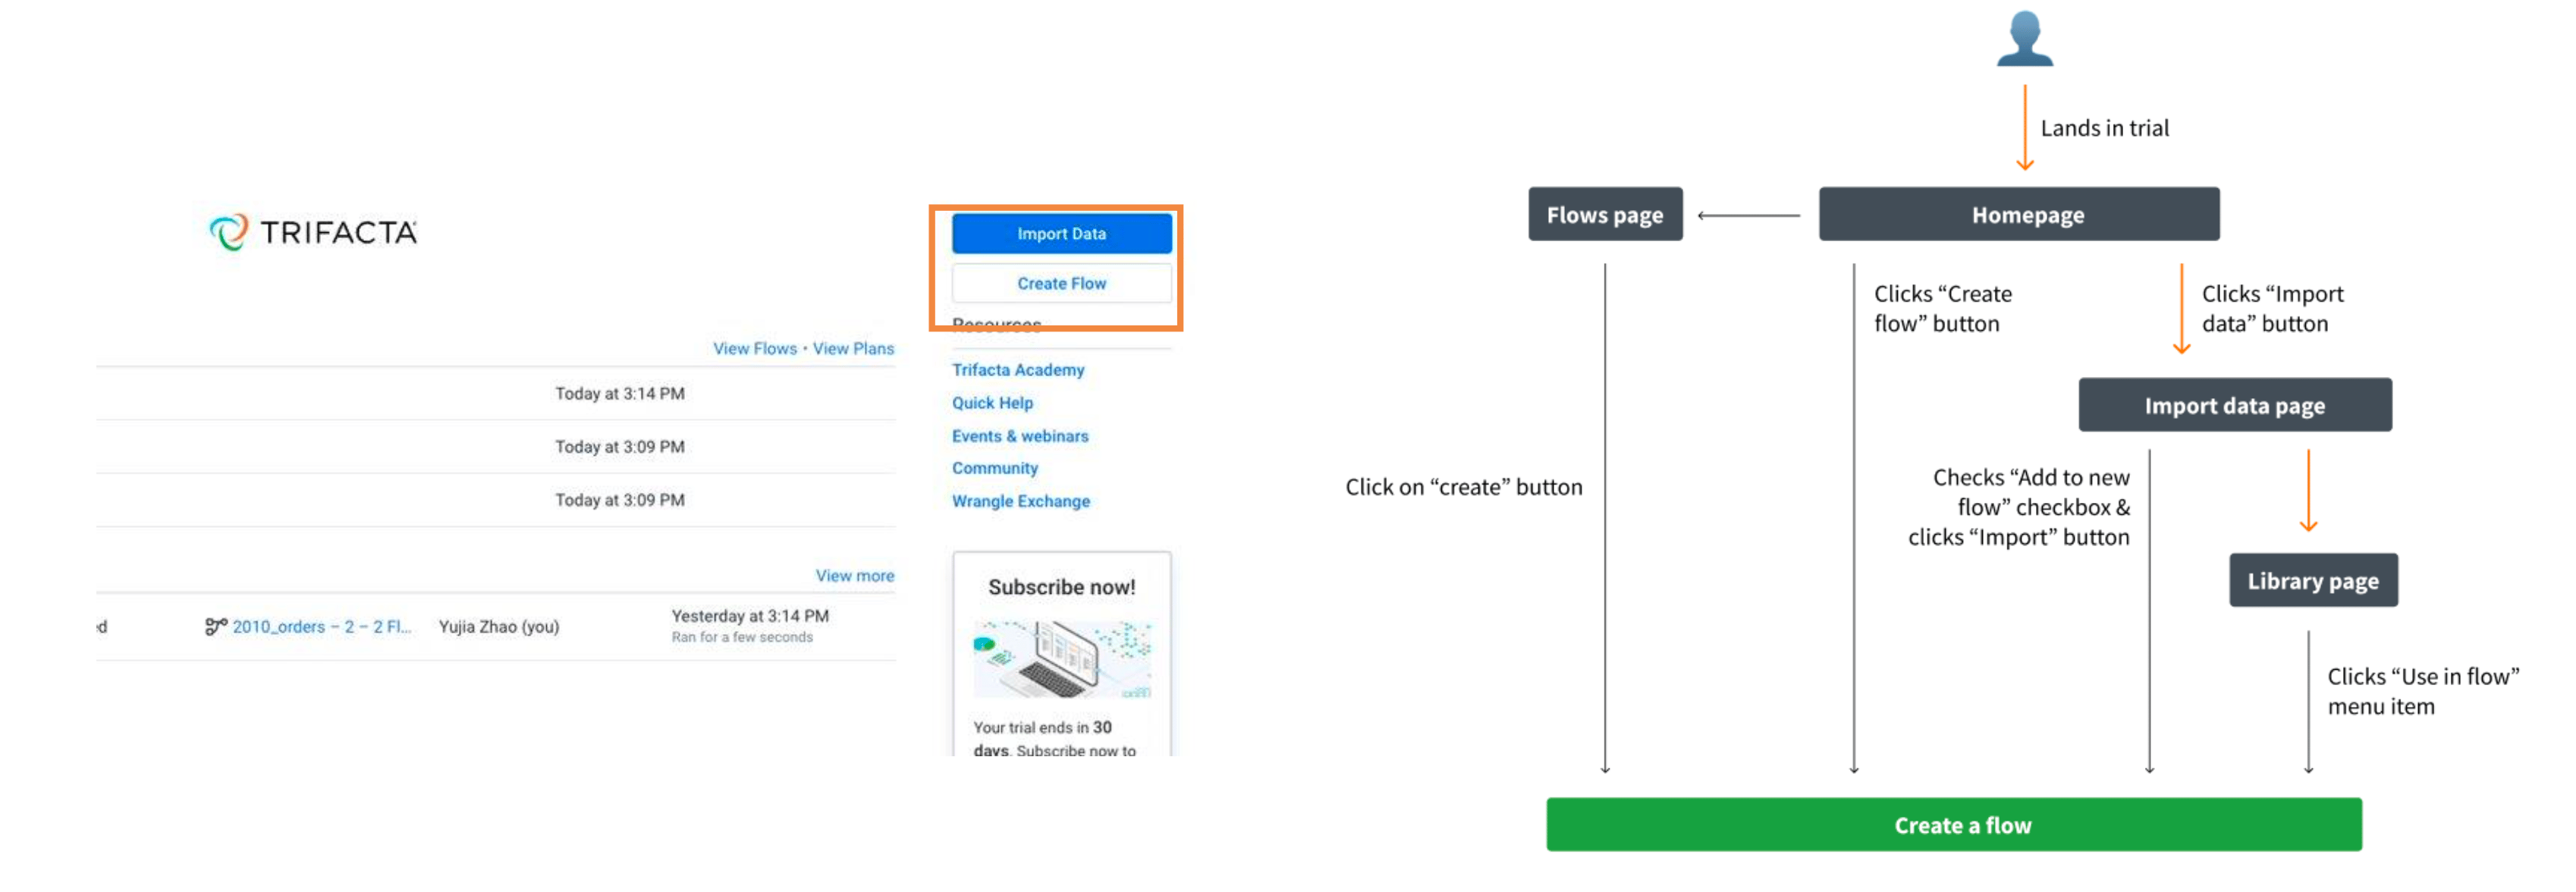
Users not knowing what a Flow is while the UI path ushers users down the most error-prone path to create a Flow.

If we can: 1) establish the mental connection between Flow and user’s data task, 2) usher users to create a Flow directly after such understanding, we should be able increase the Flow creation rate.
Test 1 - Clear starting point

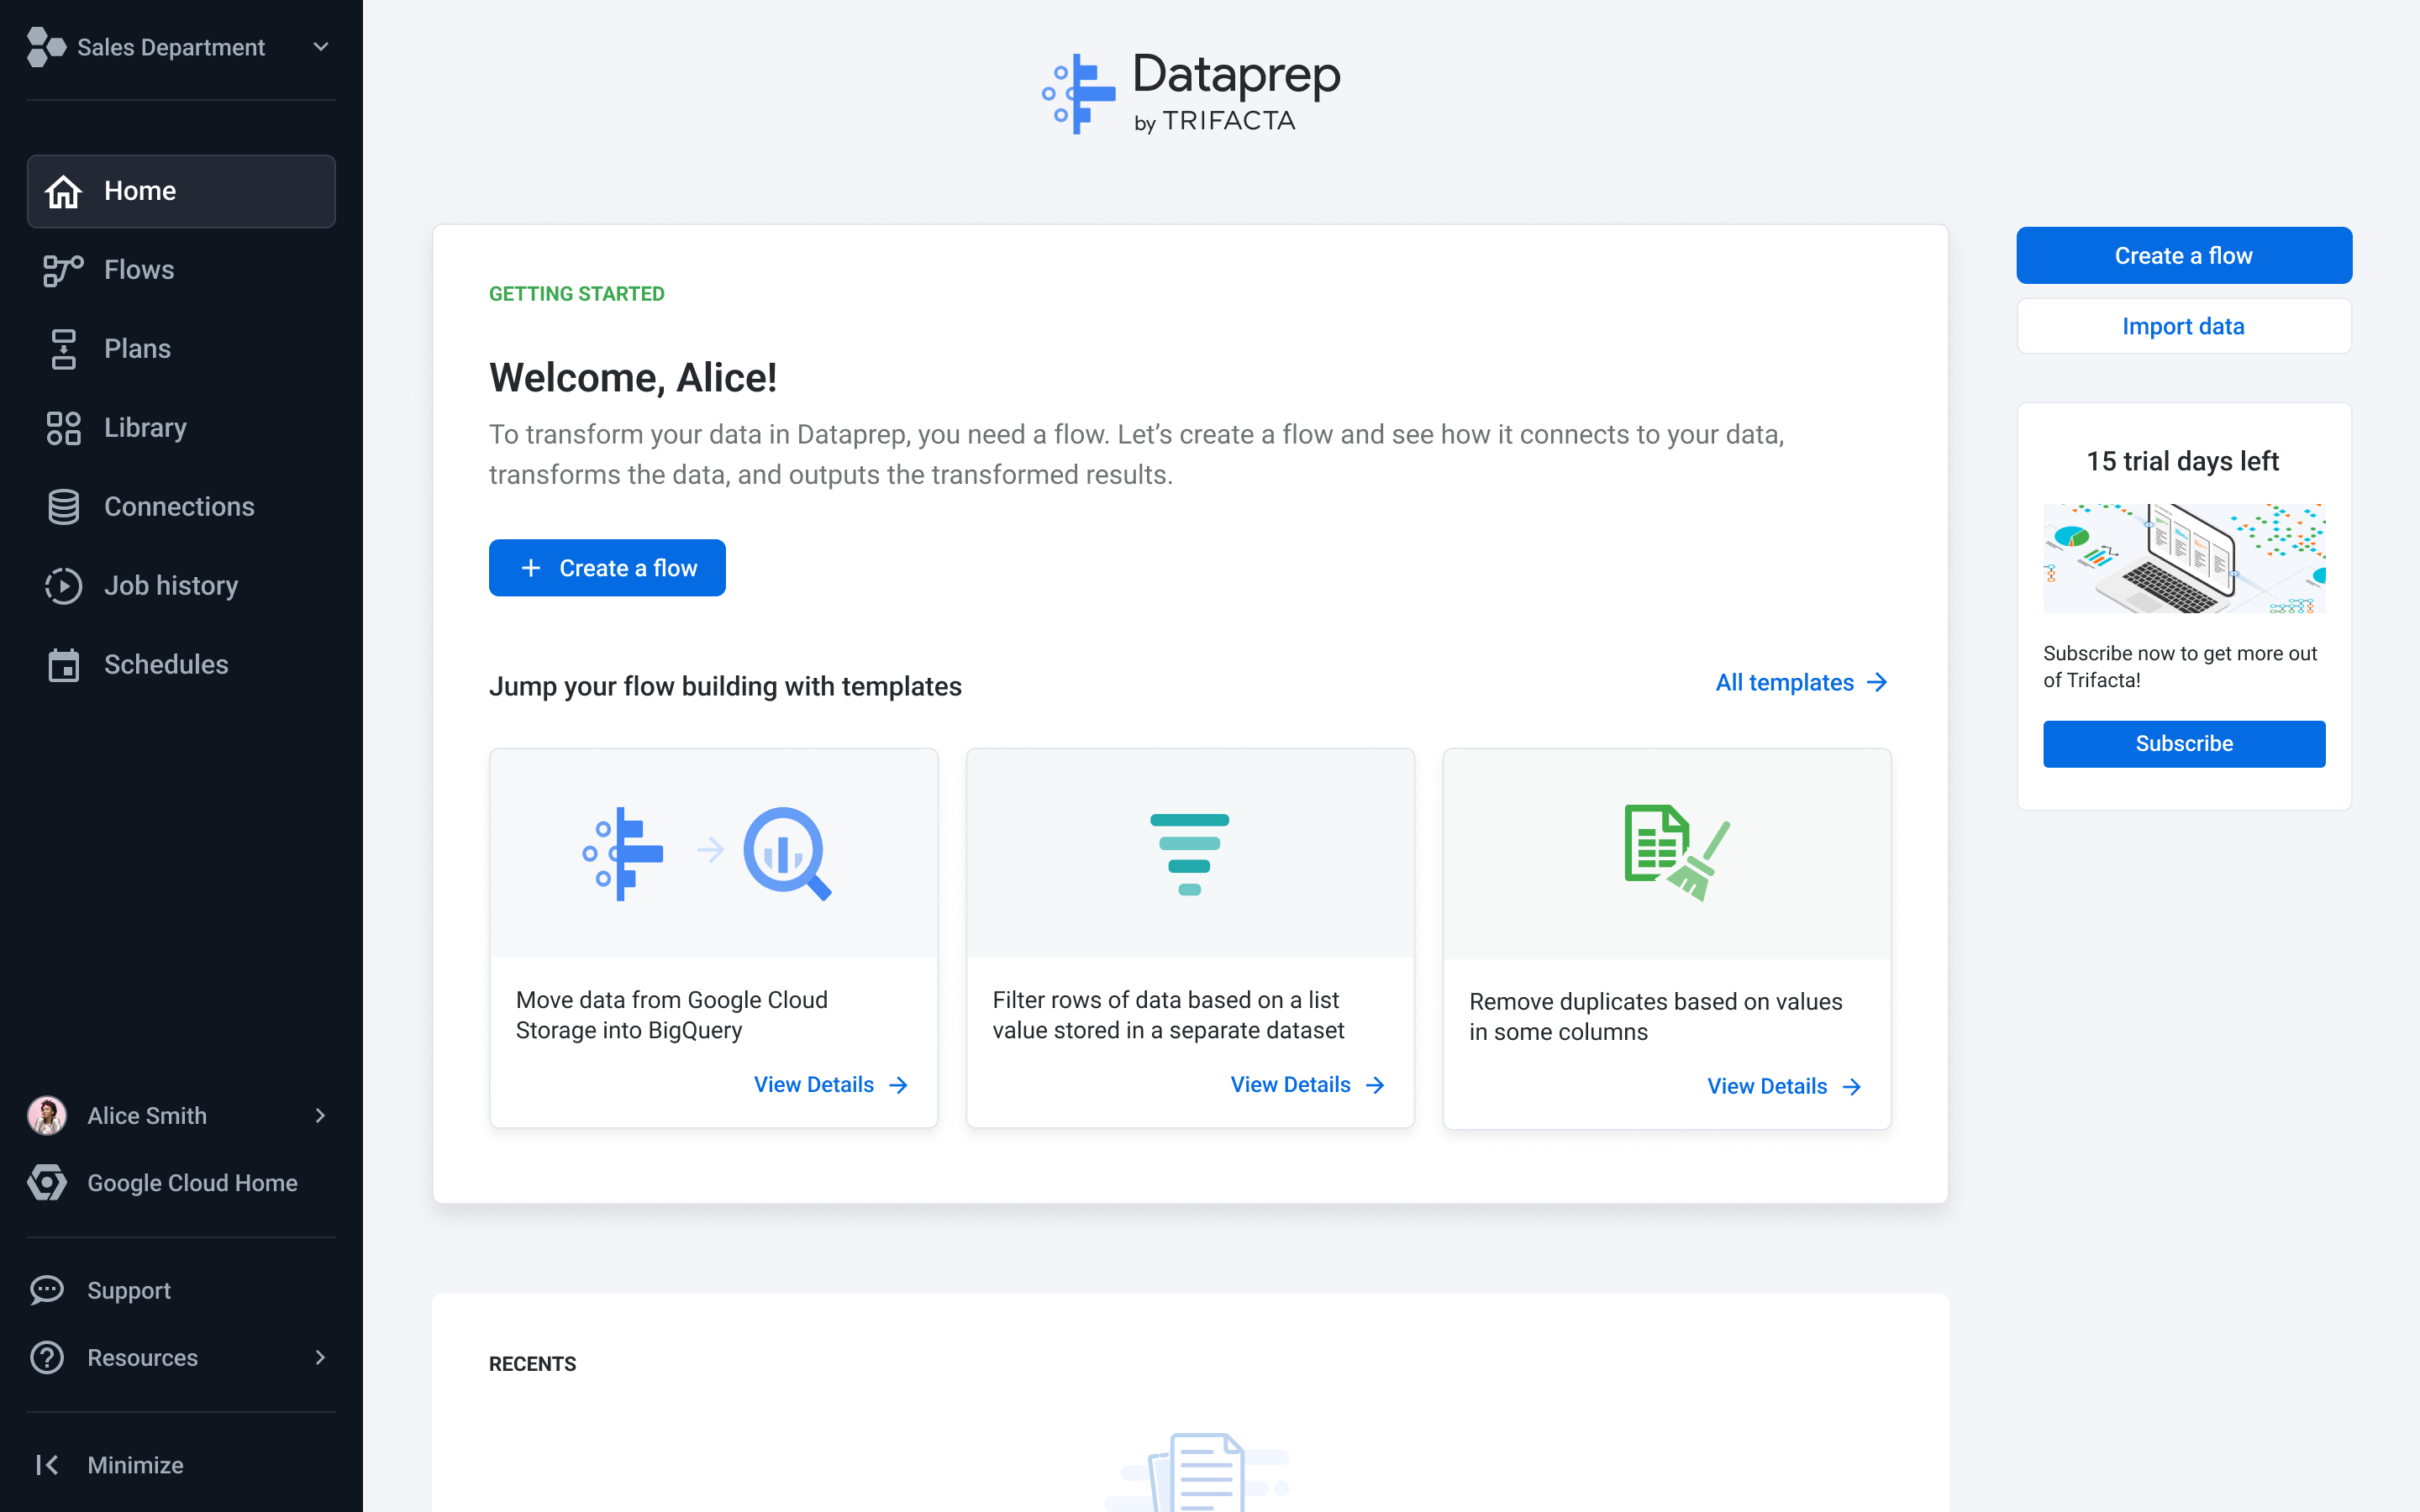
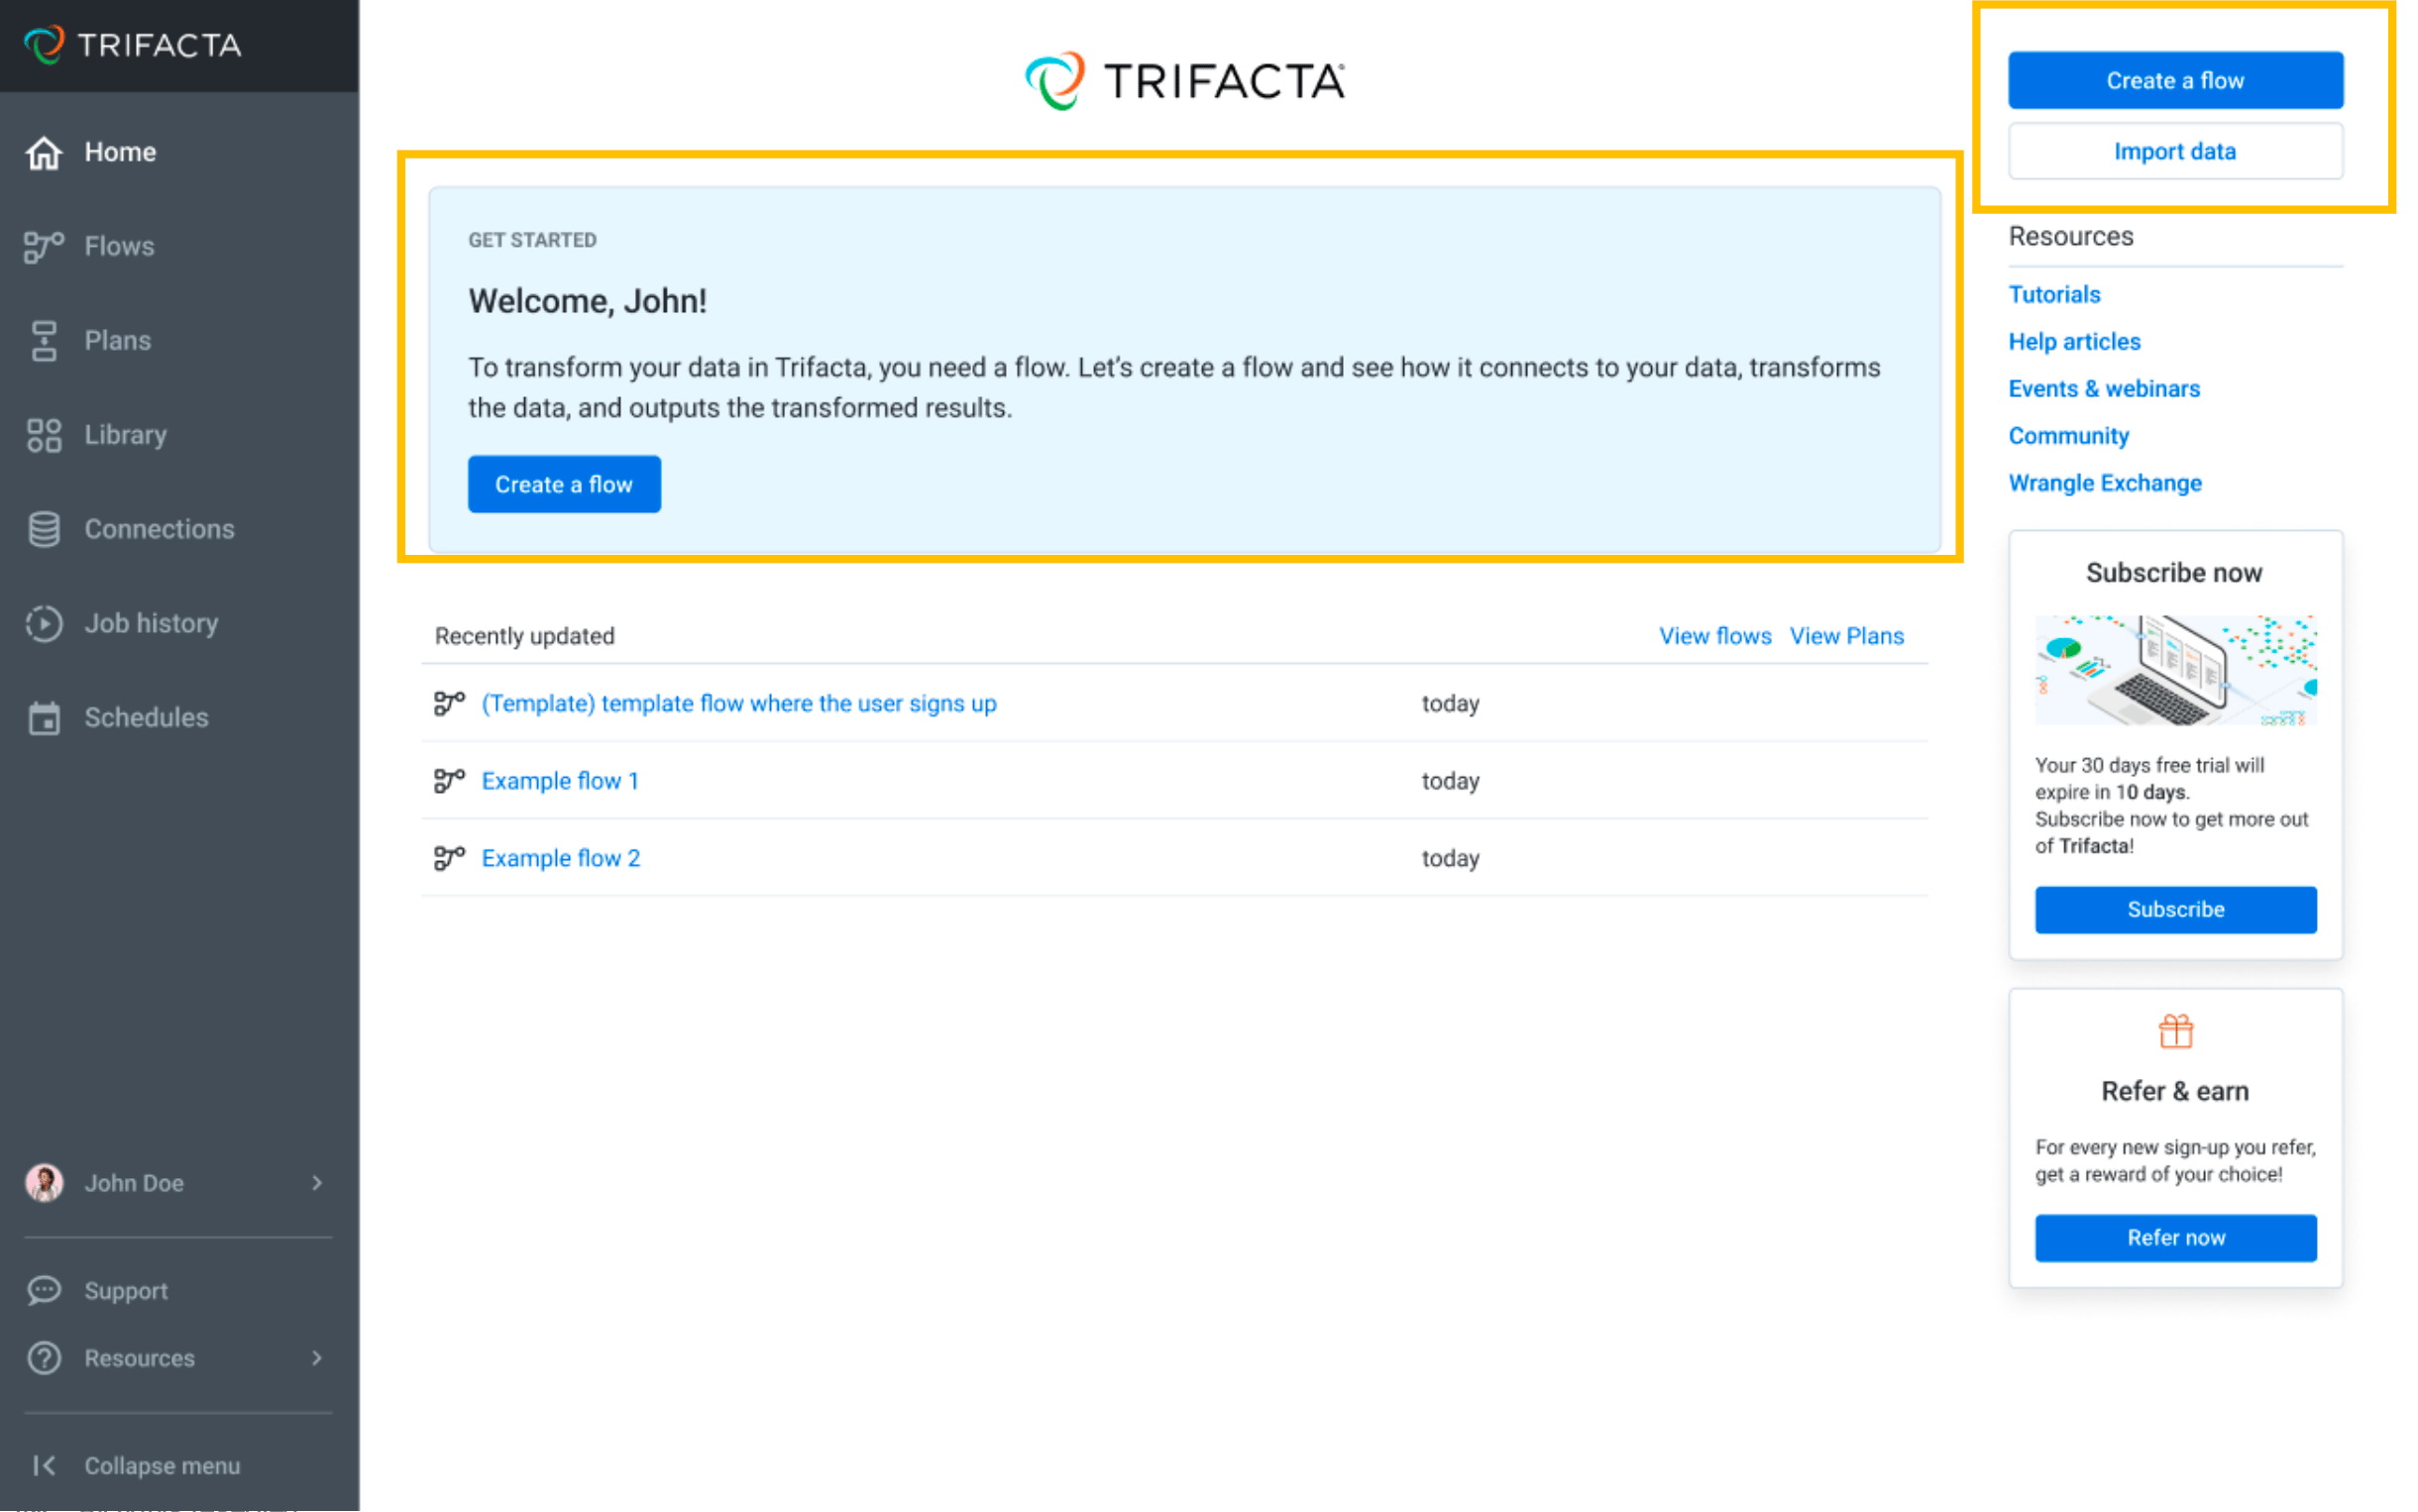
Introduce a Get Started section & flip the order of CTAs.

The Get Started section helps users to understand that Flow is what they need to transform data and guide users to create a Flow with very simple language and a direct CTA. The primary CTA sections are matching the same action priorities.
Test Result & Learning

+21%

Flow Creation Rate (experiment success metric)

+17%

First Job Run Rate

(activation metric)

+11%

Second Job Run Rate

(conversion indicator)

We saw positive impact not only to the direct experiment success metric, but also to downstream key levers of growth. We learned that introducing what Flow is helps users’ onboarding, which leads to the key value product surface area - a Flow.

Second Focus - making it dead simple to get data in

A significant drop-off at “add a dataset” step indicates users are having trouble getting data in.

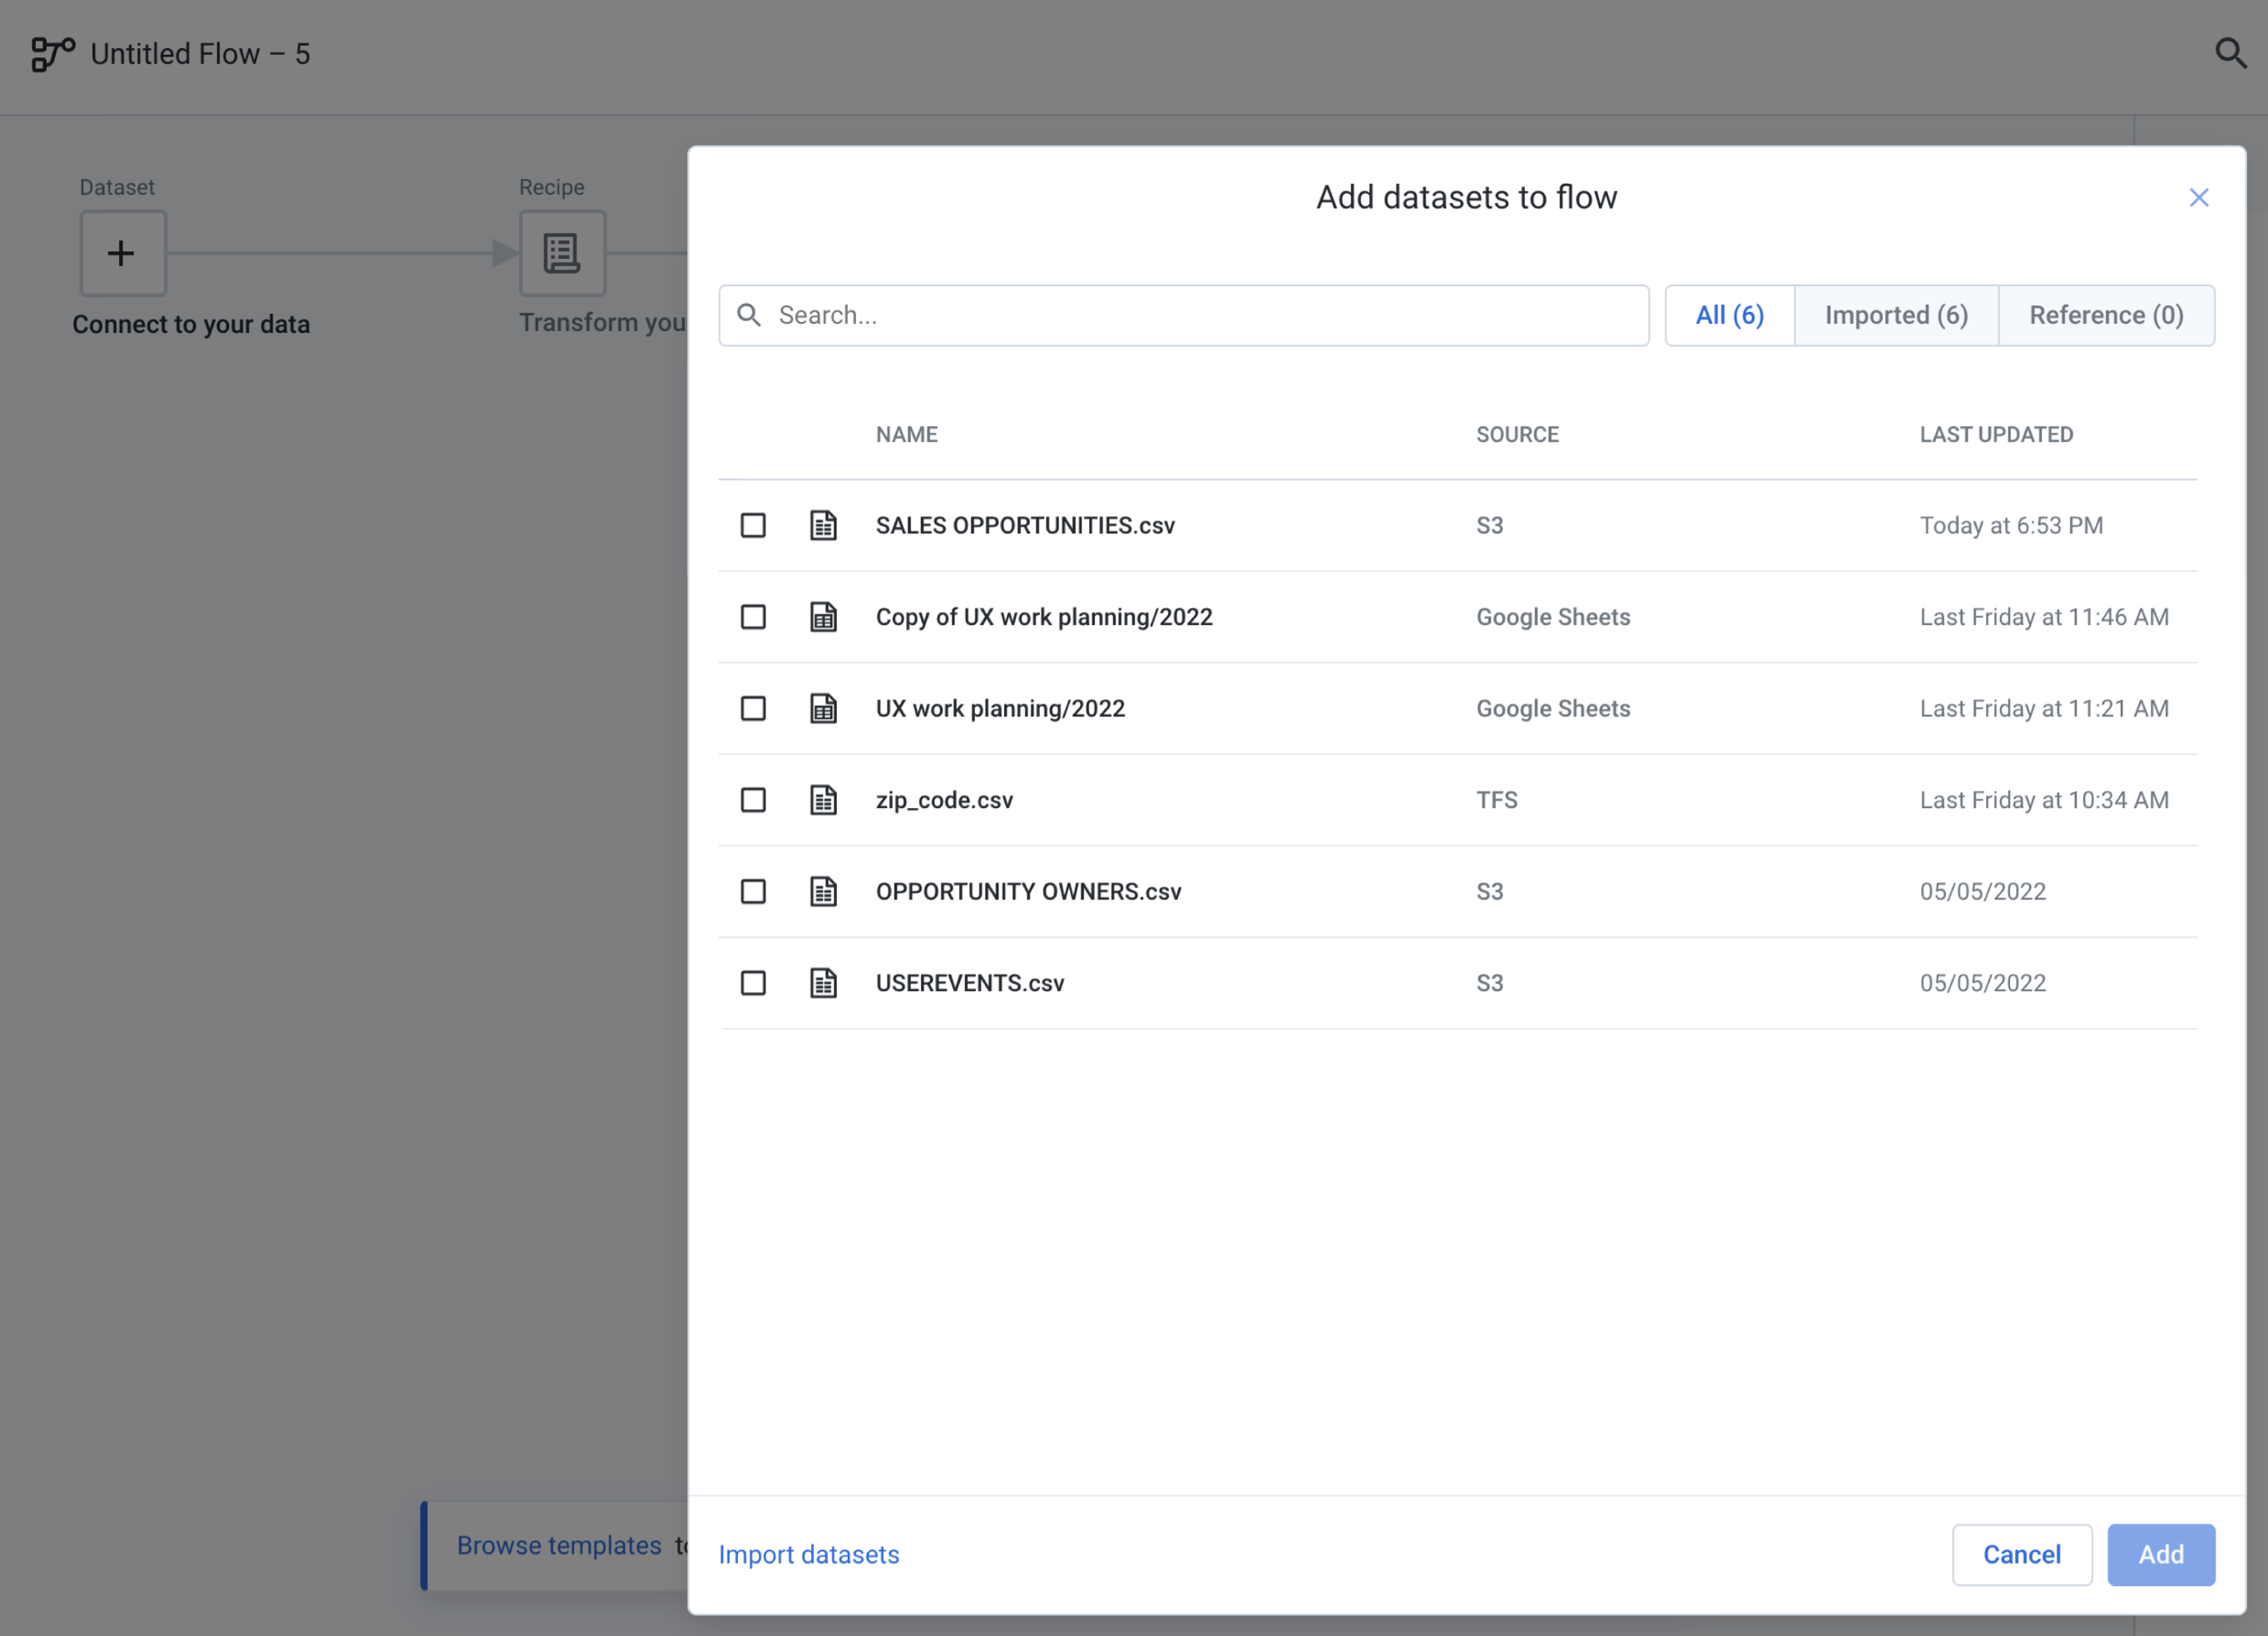
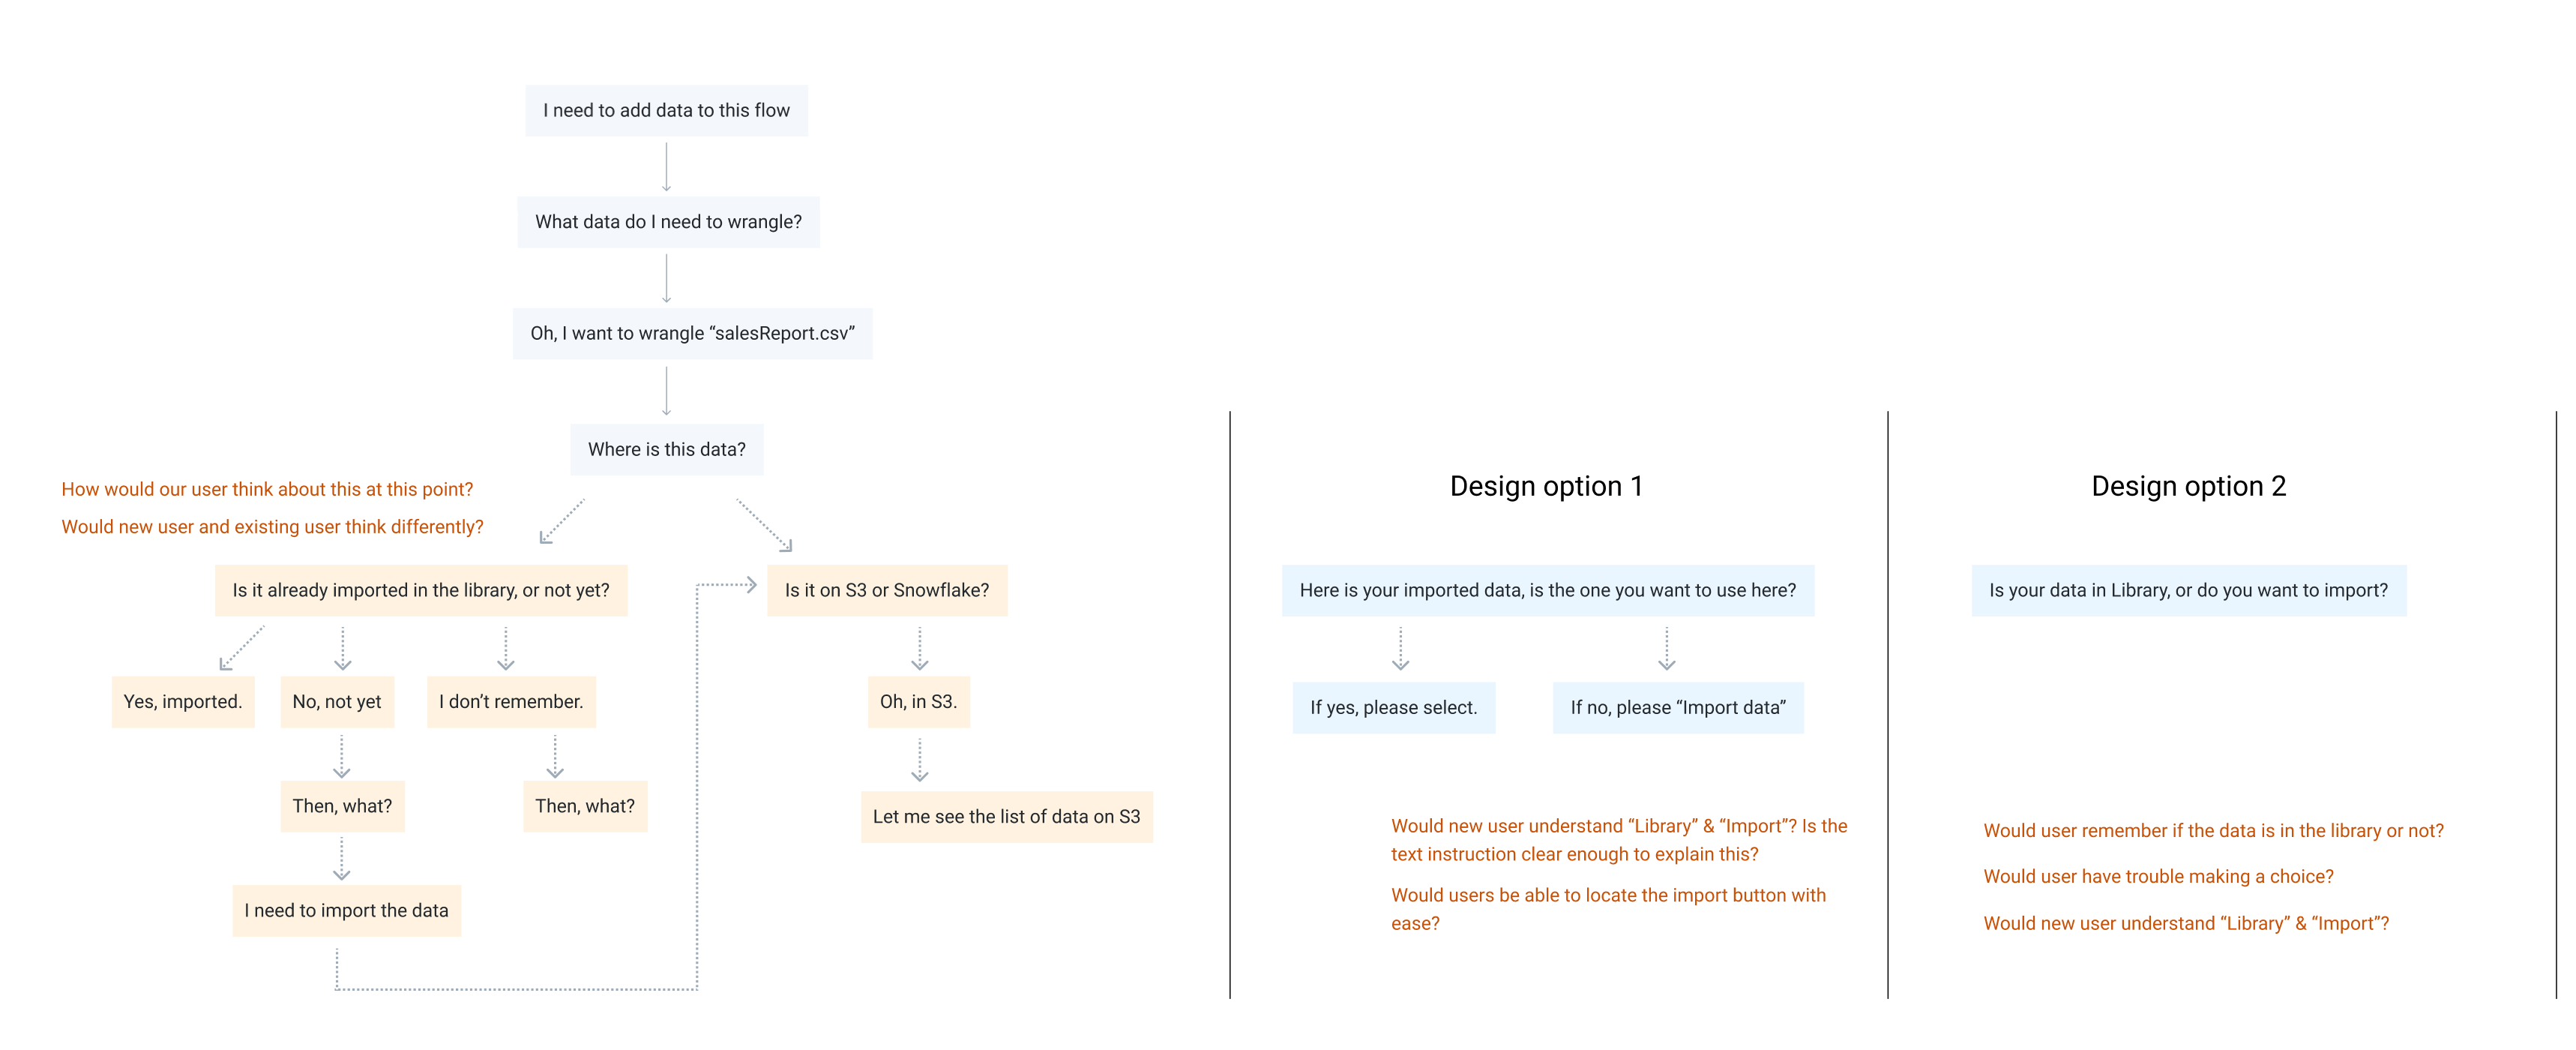
The whole point users are in Trifacta is to transform their data. If we can’t get users to connect to data, an empty Flow, even though understood and created, is useless. As shown in the image, the add dataset to flow model doesn’t have a clear way to add new data.
Analysis & Hypothesis

For new users, this model is empty, and without a clear CTA to import data.

If we can: 1) make this a comprehensive UI for all data importing options, 2) make it very simple, users should be able to add data to their flow.
Test 2 - streamline adding data

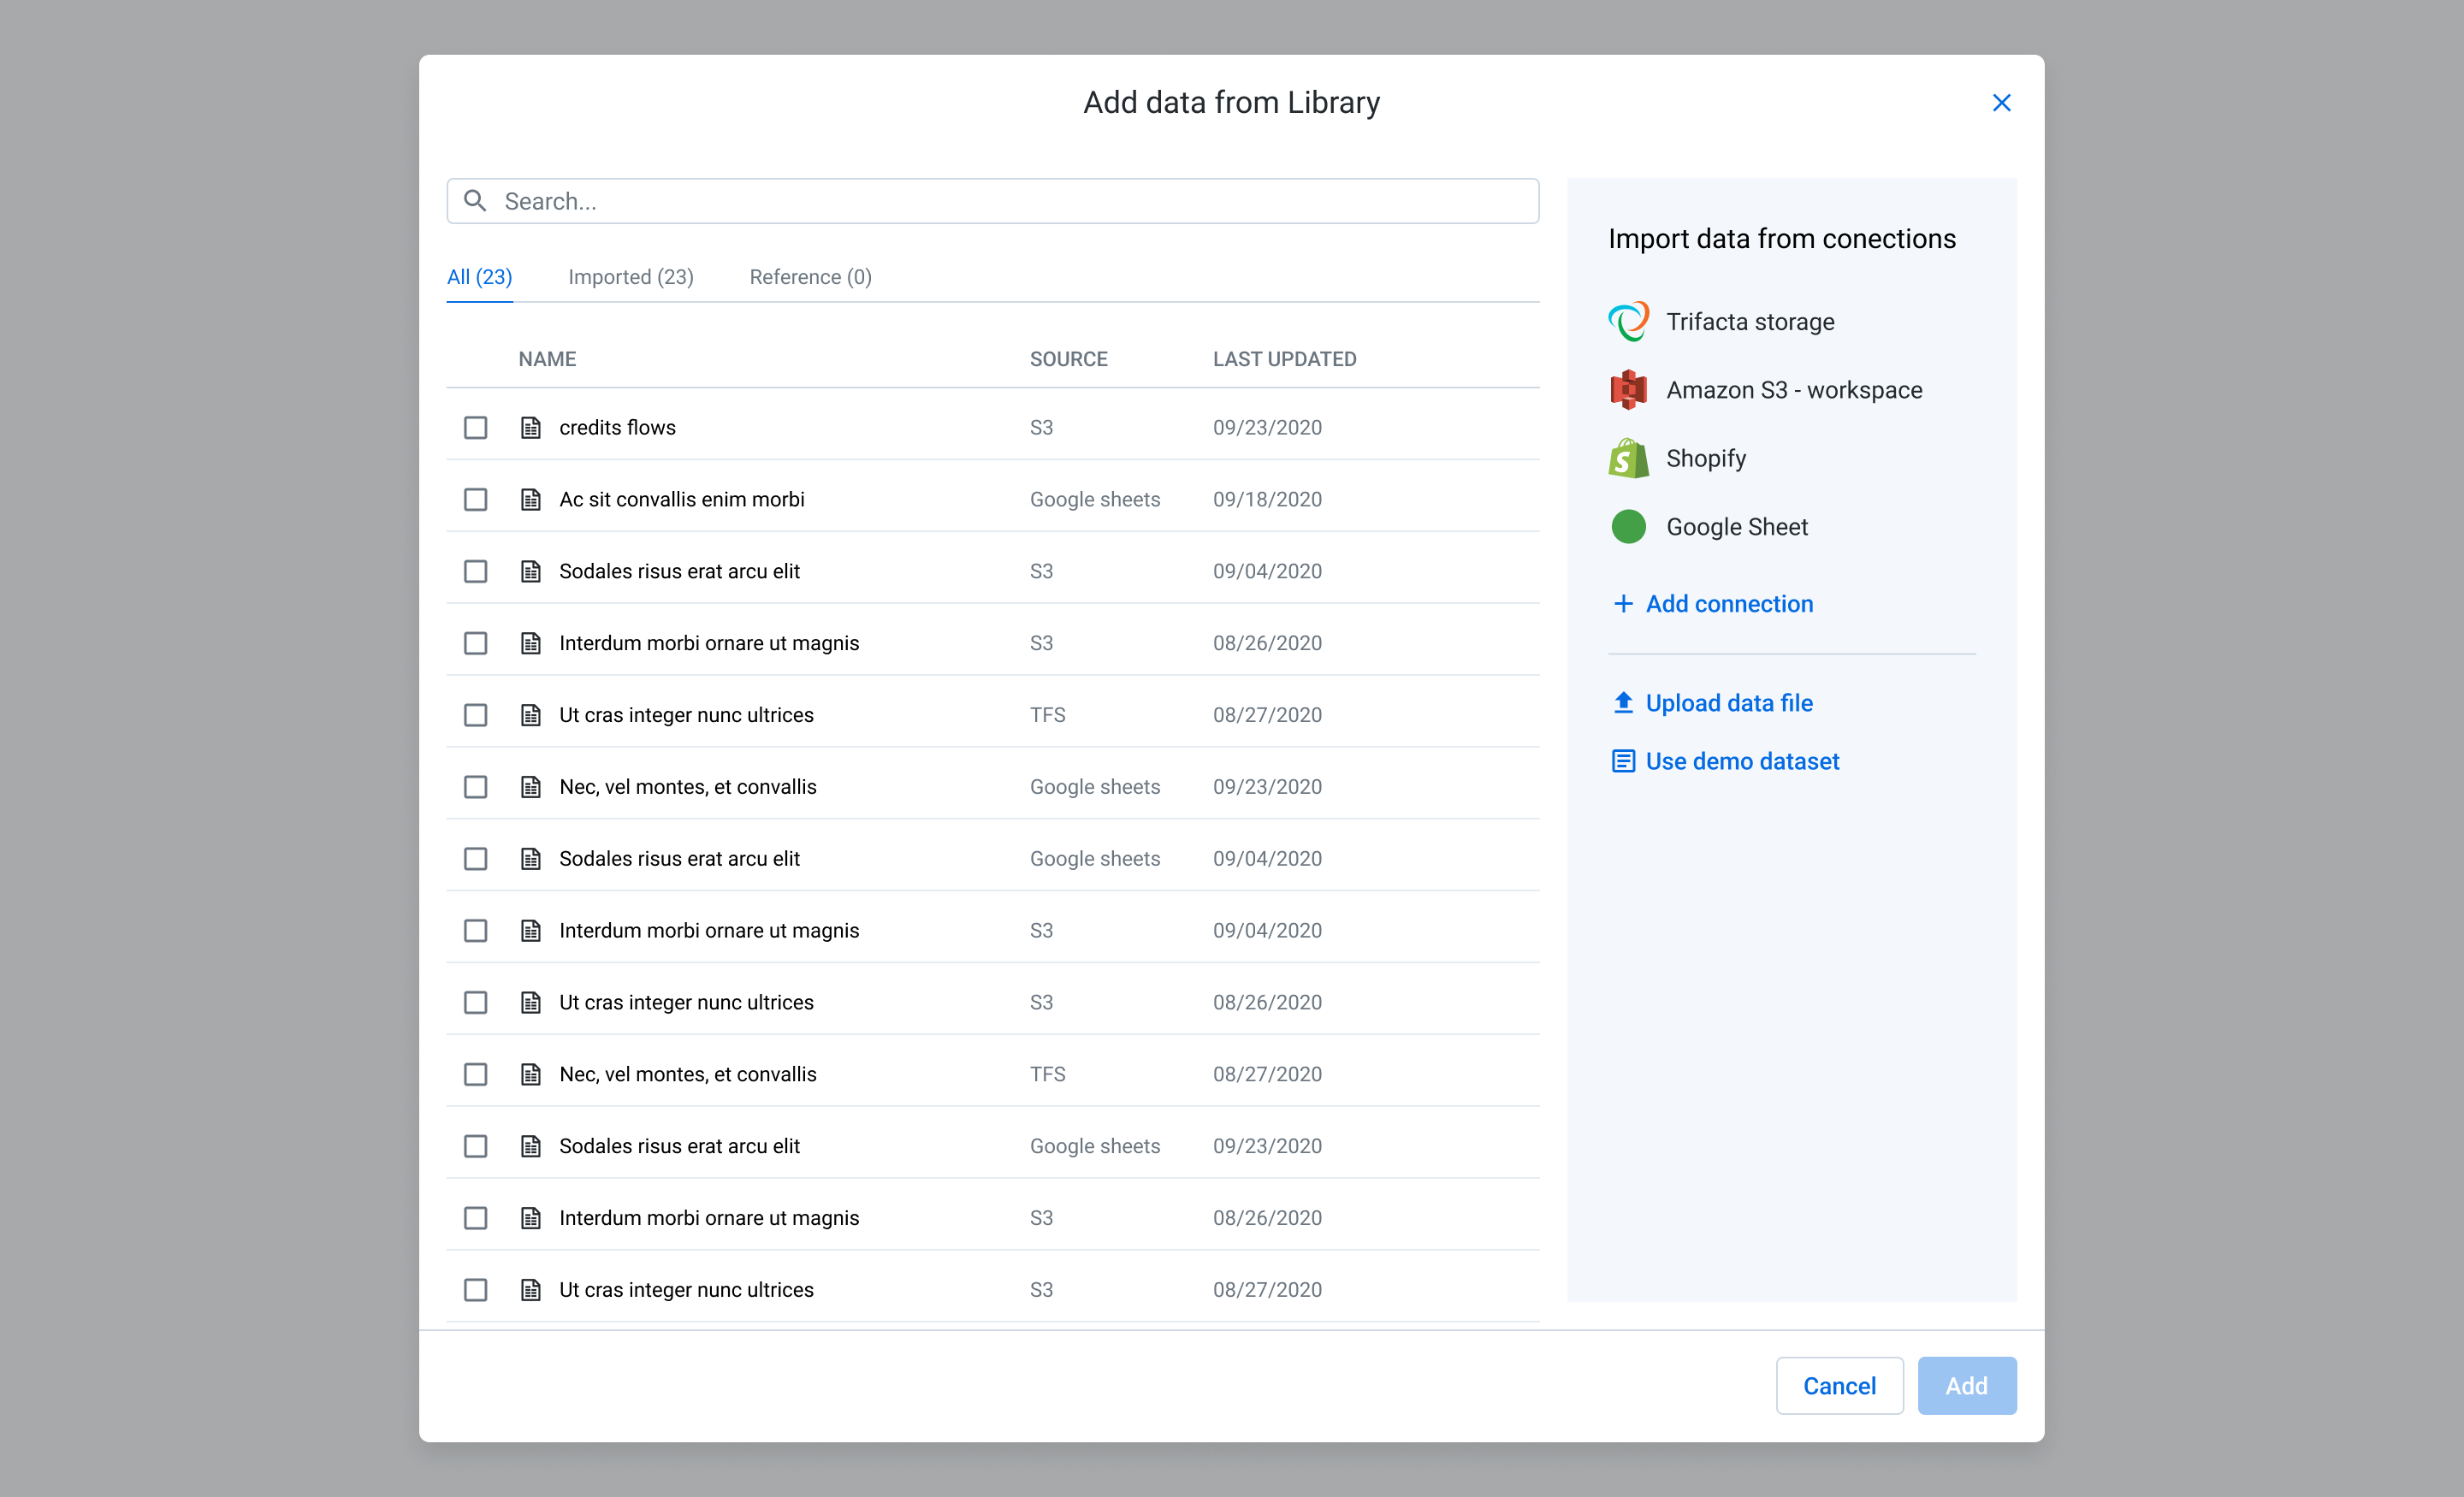
A right panel outlining all options for where and how to add data

This panel works for new and existing users when they want to add data to the current flow. It outlines all options right there instead of directing users to “Import Data” page.
Test Result & Learning

+6%

Data Added Rate

We learned that sometimes a usability optimization for a page without changing any feature or functionality can go along way.

Other experiments

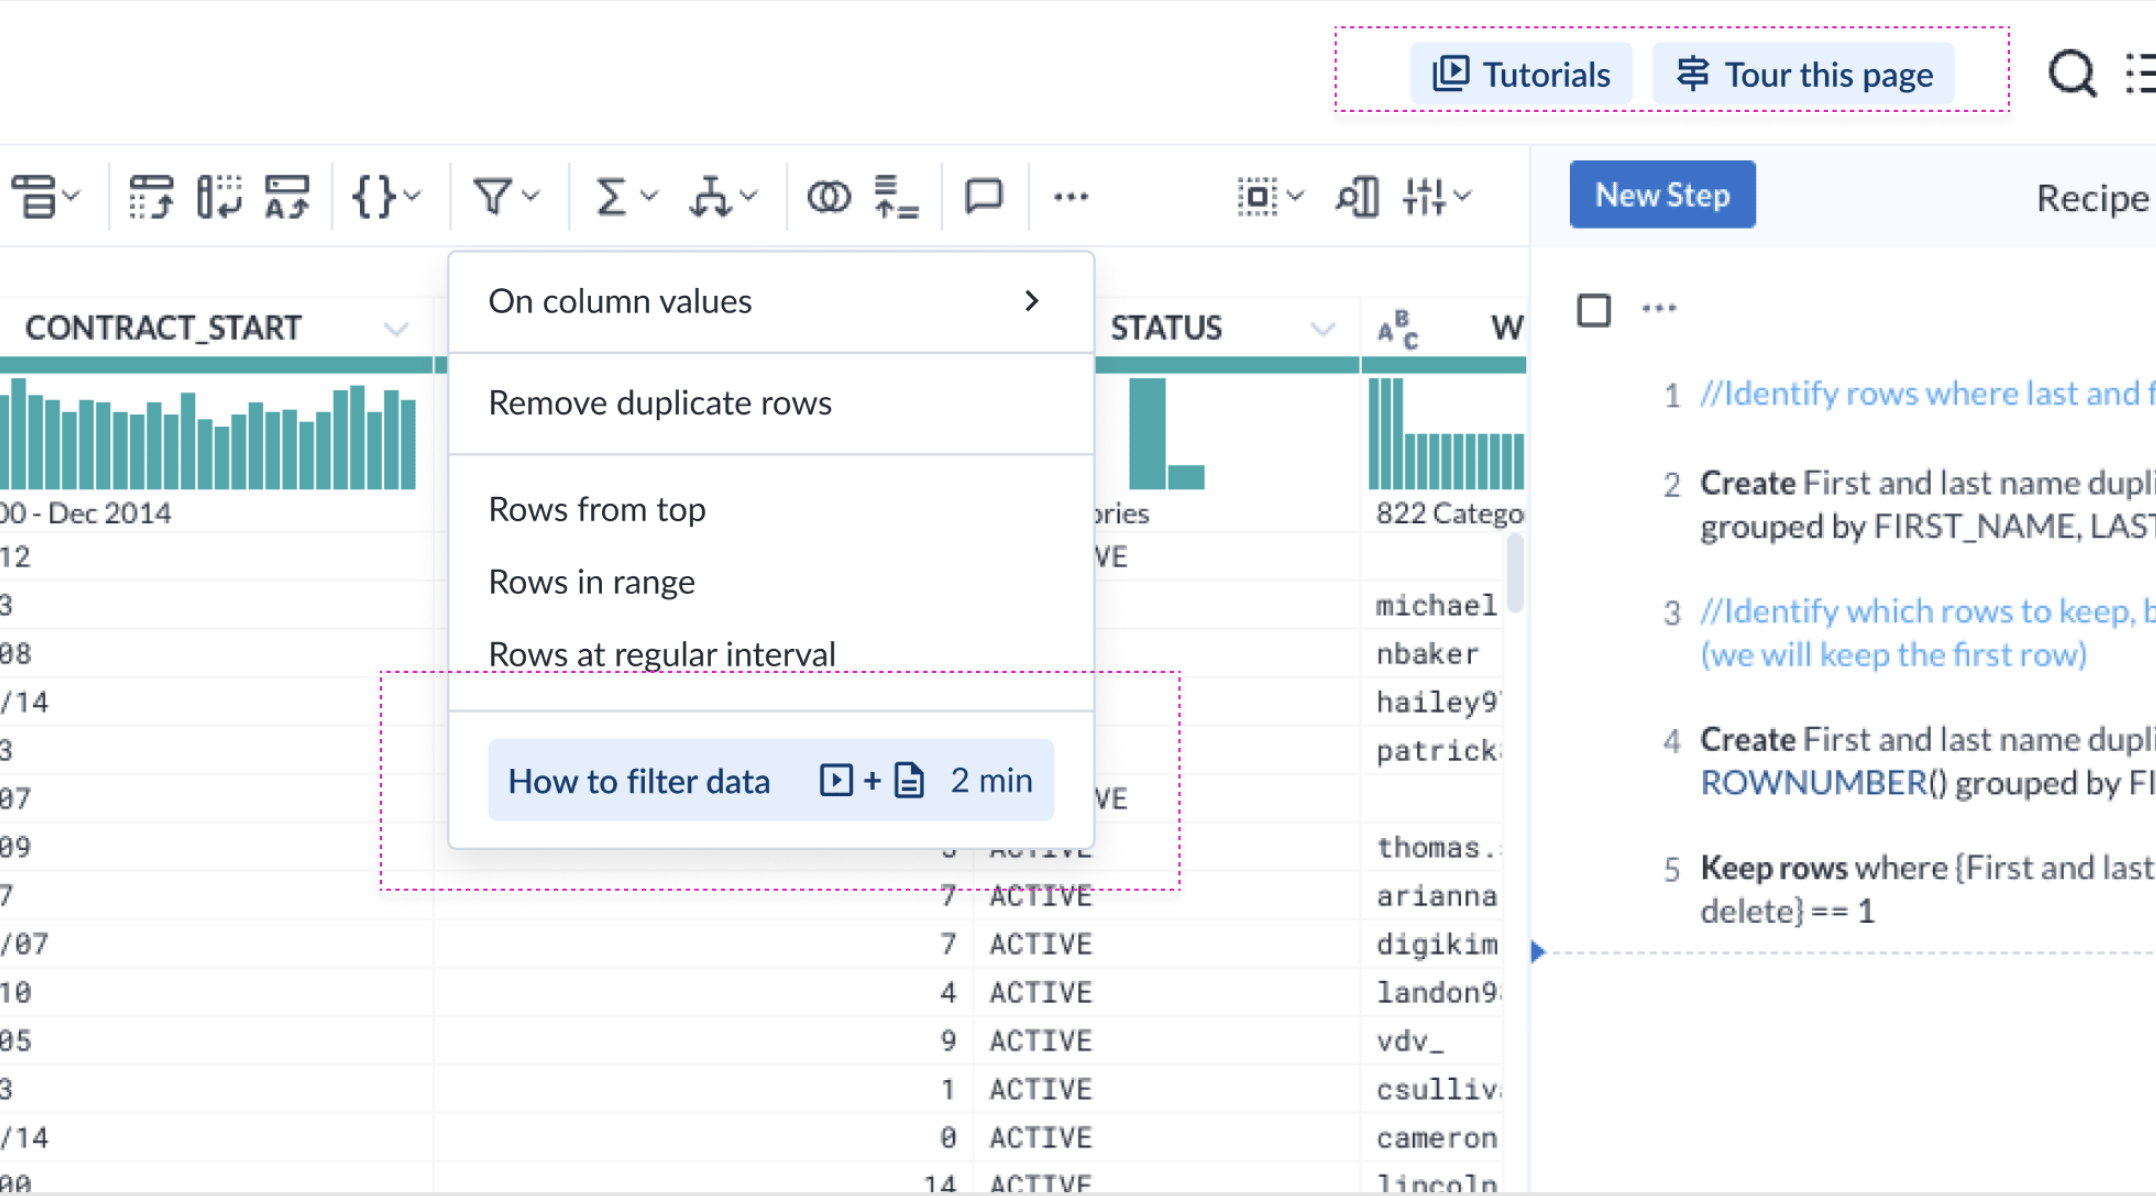
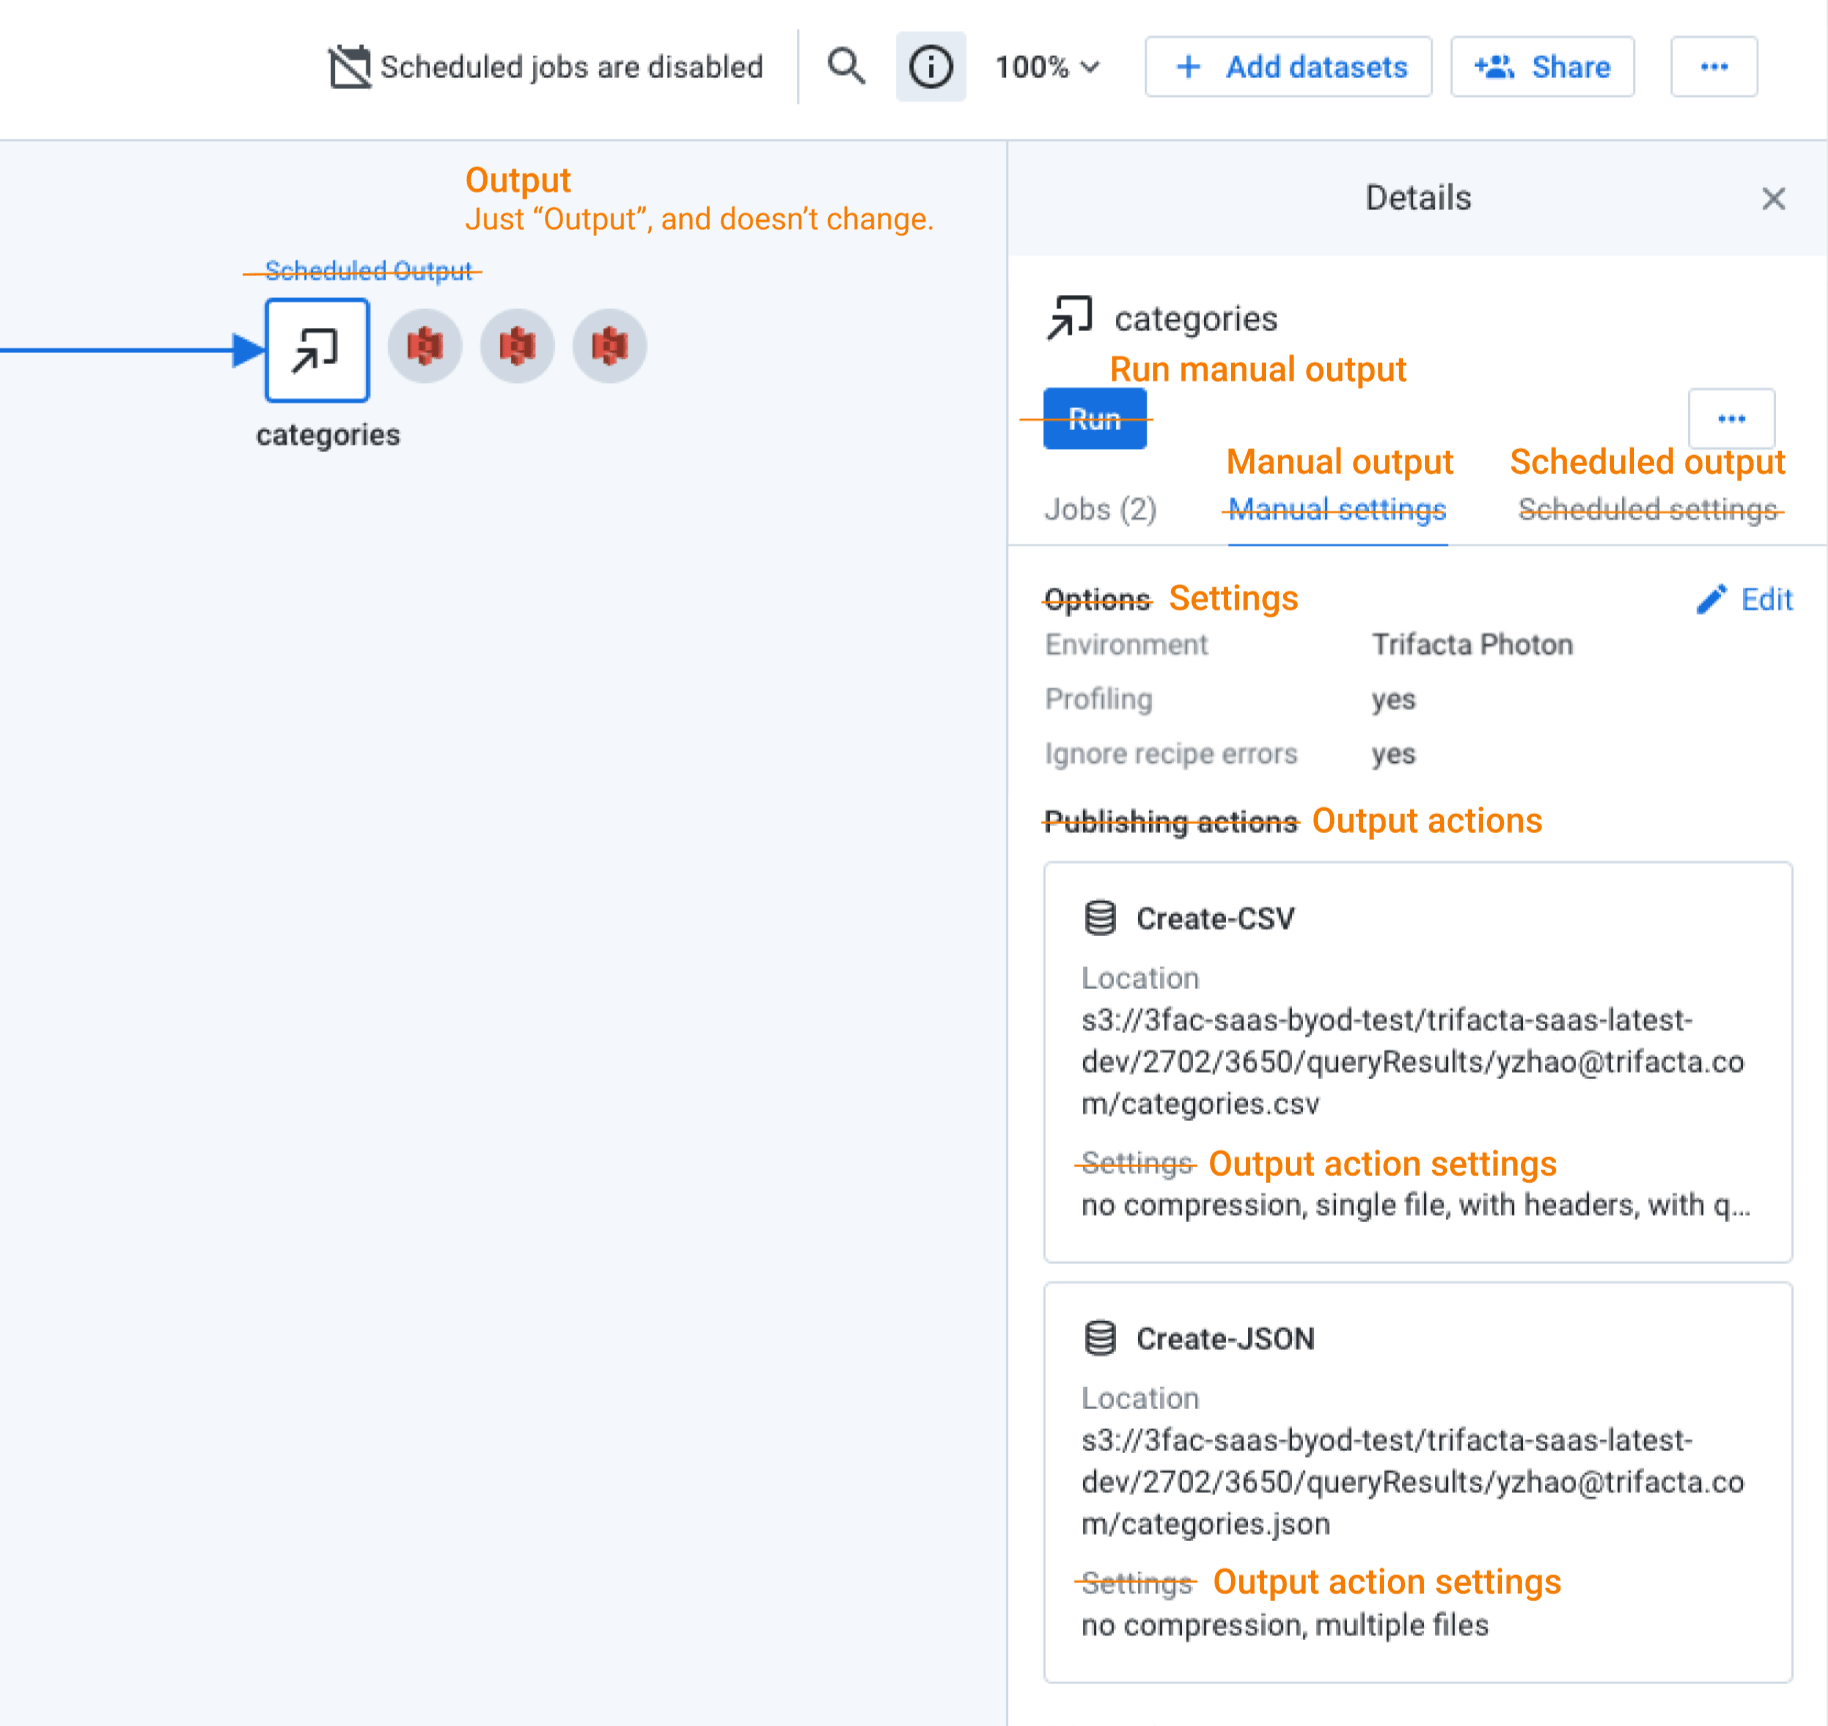
We conducted numerous experiments and made many improvements mostly without changing functionality.

We continued to analyze, hypothesize, and experiment new ideas along the user journey, addressing many friction points. Some noteworthy ones are: improving in-context help, cleaning up terminology, adding dataset-level recommendations, etc.
Outcome & Impact

+200%

Trial-to-paid Conversion Rate

+17%

Trial Signup Rate

132k→1.6MM

Self-service ARR

2→20

New logos per month through Trial

Over 16 months, we achieved significant business outcome through optimizing user experience through thoughtful analysis of user needs, mental model, journeys, and frictions, and rolling out changes with the utter most simplicity.

/yujiazhao

zhaoyujia930@gmail.com

© Yujia Zhao 2026

Yujia Zhao

Work

About

Product-led growth for a no-code data prep enterprise tool

trial & GROWTH

onboarding

journey design

Improved trial-to-paid conversion rate by 200% through journey & friction analysis, A/B testing experiments, and streamlining user experience.

Trifacta, a no-code cloud data cleansing & preparation tool, established a Growth Team, with the mission of acquiring, engaging, and retaining small to medium customers through trials and product-led growth. I was the UX Team Lead on the Growth Team, responsible for:

  • Define growth strategy with Product and Engineering Leaders
  • Design projects planning
  • Hand-on execution of growth project as well as overseeing another junior designer’s work in a fast-paced environment.

My role

Lead Designer

Worked with

1 designers, 2 PMs, 1 Tech Lead, 1 Data Analyst

Time

2022-2023

Journey & Frictions Workshop

Surface and align on the end-to-end user journey

Growth practice is based on the cycle of hypothesis, A/B experiment testing, and learning. However, as a designer, I want to ground hypothesis in user insights, and that starts from the end-to-end user journey and our shared understanding of the frictions distributed in cross-functional teams.

First focus - top of the tunnel

We are losing half the people at the very beginning of the journey

Equipped with a holistic understanding, we also dived into data to see what part of the journey to focus first. We learned that we have a near 50% drop-off for Flow creation. This is very concerning, because Flow is the only object/vehicle in Trifacta for users to transform data. If they are not even creating Flows, they are definitely not experiencing aha moment, let alone subscribe.

Hypothesis

Users not knowing what a Flow is while the UI path ushers users down the most error-prone path to create a Flow.

If we can: 1) establish the mental connection between Flow and user’s data task, 2) usher users to create a Flow directly after such understanding, we should be able increase the Flow creation rate.

Test 1 - Clear starting point

Introduce a Get Started section & flip the order of CTAs.

The Get Started section helps users to understand that Flow is what they need to transform data and guide users to create a Flow with very simple language and a direct CTA. The primary CTA sections are matching the same action priorities.

Test Result & Learning

+21%

Flow Creation Rate (experiment success metric)

+17%

First Job Run Rate

(activation metric)

+11%

Second Job Run Rate

(conversion indicator)

We saw positive impact not only to the direct experiment success metric, but also to downstream key levers of growth. We learned that introducing what Flow is helps users’ onboarding, which leads to the key value product surface area - a Flow.

Second Focus - making it dead simple to get data in

A significant drop-off at “add a dataset” step indicates users are having trouble getting data in.

The whole point users are in Trifacta is to transform their data. If we can’t get users to connect to data, an empty Flow, even though understood and created, is useless. As shown in the image, the add dataset to flow model doesn’t have a clear way to add new data.

Analysis & Hypothesis

For new users, this model is empty, and without a clear CTA to import data.

If we can: 1) make this a comprehensive UI for all data importing options, 2) make it very simple, users should be able to add data to their flow.

Test 2 - streamline adding data

A right panel outlining all options for where and how to add data

This panel works for new and existing users when they want to add data to the current flow. It outlines all options right there instead of directing users to “Import Data” page.

Test Result & Learning

+6%

Data Added Rate

We learned that sometimes a usability optimization for a page without changing any feature or functionality can go along way.

Other experiments

We conducted numerous experiments and made many improvements mostly without changing functionality.

We continued to analyze, hypothesize, and experiment new ideas along the user journey, addressing many friction points. Some noteworthy ones are: improving in-context help, cleaning up terminology, adding dataset-level recommendations, etc.
Outcome & Impact

+200%

Trial-to-paid Conversion Rate

+17%

Trial Signup Rate

132k→1.6MM

Self-service ARR

2→20

New logos per month through Trial

Over 16 months, we achieved significant business outcome through optimizing user experience through thoughtful analysis of user needs, mental model, journeys, and frictions, and rolling out changes with the utter most simplicity.

/yujiazhao

zhaoyujia930@gmail.com

© Yujia Zhao 2026

Yujia Zhao

Work

About

Product-led growth for no-code data prep enterprise tool

trial & GROWTH

onboarding

journey design

Improved trial-to-paid conversion rate by 200% through journey & friction analysis, A/B testing experiments, and streamlining user experience.

Trifacta, a no-code cloud data cleansing & preparation tool, established a Growth Team, with the mission of acquiring, engaging, and retaining small to medium customers through trials and product-led growth. I was the UX Team Lead on the Growth Team, responsible for:

  • Define growth strategy with Product and Engineering Leaders
  • Design projects planning
  • Hand-on execution of growth project as well as overseeing another junior designer’s work in a fast-paced environment.

My role

Lead Designer

Worked with

1 designers, 2 PMs, 1 Tech Lead, 1 Data Analyst

Time

2022-2023

Journey & Frictions Workshop

Surface and align our understanding of the holistic user journey

Growth practice is based on the cycle of hypothesis, A/B experiment testing, and learning. However, as a designer, I want to ground hypothesis in user insights, and that starts from the end-to-end user journey and our shared understanding of the frictions distributed in cross-functional teams.

First focus - top of the tunnel

We are losing half the people at the very beginning of the journey

Equipped with a holistic understanding, we also dived into data to see what part of the journey to focus first. We learned that we have a near 50% drop-off for Flow creation. This is very concerning, because Flow is the only object/vehicle in Trifacta for users to transform data. If they are not even creating Flows, they are definitely not experiencing aha moment, let alone subscribe.

Hypothesis

Users not knowing what a Flow is while the UI path ushers users down the most error-prone path to create a Flow.

If we can: 1) establish the mental connection between Flow and user’s data task, 2) usher users to create a Flow directly after such understanding, we should be able increase the Flow creation rate.

Test 1 - Clear starting point

Introduce a Get Started section & flip the order of CTAs.

The Get Started section helps users to understand that Flow is what they need to transform data and guide users to create a Flow with very simple language and a direct CTA. The primary CTA sections are matching the same action priorities.

Test Result & Learning

+21%

Flow Creation Rate (experiment success metric)

+17%

First Job Run Rate

(activation metric)

+11%

Second Job Run Rate

(conversion indicator)

We saw positive impact not only to the direct experiment success metric, but also to downstream key levers of growth. We learned that introducing what Flow is helps users’ onboarding, which leads to the key value product surface area - a Flow.

Second Focus - making it dead simple to get data in

A significant drop-off at “add a dataset” step indicates users are having trouble getting data in.

The whole point users are in Trifacta is to transform their data. If we can’t get users to connect to data, an empty Flow, even though understood and created, is useless. As shown in the image, the add dataset to flow model doesn’t have a clear way to add new data.

Analysis & Hypothesis

For new users, this model is empty, and without a clear CTA to import data.

If we can: 1) make this a comprehensive UI for all data importing options, 2) make it very simple, users should be able to add data to their flow.

Test 2 - streamline adding data

A right panel outlining all options for where and how to add data

This panel works for new and existing users when they want to add data to the current flow. It outlines all options right there instead of directing users to “Import Data” page.

Test Result & Learning

+6%

Data Added Rate

We learned that sometimes a usability optimization for a page without changing any feature or functionality can go along way.

Other experiments

We conducted numerous experiments and made many improvements mostly without changing functionality.

We continued to analyze, hypothesize, and experiment new ideas along the user journey, addressing many friction points. Some noteworthy ones are: improving in-context help, cleaning up terminology, adding dataset-level recommendations, etc.

Outcome & Impact

+200%

Trial-to-paid Conversion Rate

2.5x

Trial Signup Rate

132k→1.6MM

Self-service ARR

2→20

New logos per month through Trial

Over 16 months, we achieved significant business outcome through optimizing user experience through thoughtful analysis of user needs, mental model, journeys, and frictions, and rolling out changes with the utter most simplicity.